We’ve updated our CFPB complaint dashboard below.
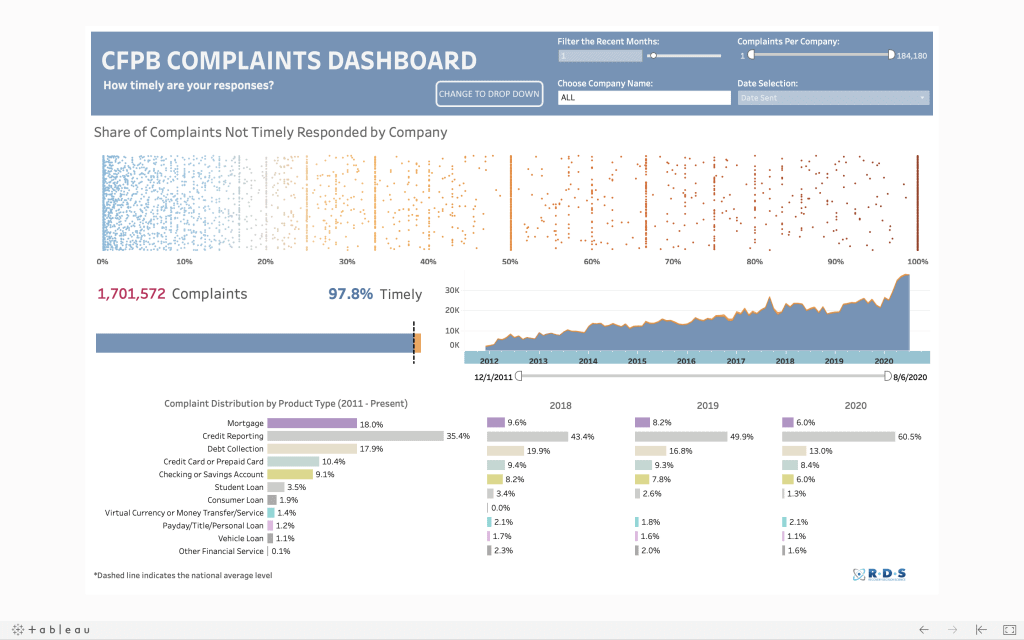
If you are unfamiliar with the dashboard, it includes a company-by-company analysis of response times to complaints to the CFPB. Users can select a company from the pull-down menu. Then, using the dot-plot, you can compare that company to any of the more than 81,000 companies in the CFPB database in terms of timely response to complaints. As you work with the dot-plot, remember that blue is positive, meaning timely responses, and orange is negative.
Users can also do a deep dive on a company’s performance relative to a number of factors:
- Total number of complaints
- Complaints over time
- Percent of complaints that are responded to in a timely manner (i.e. within 30 days)
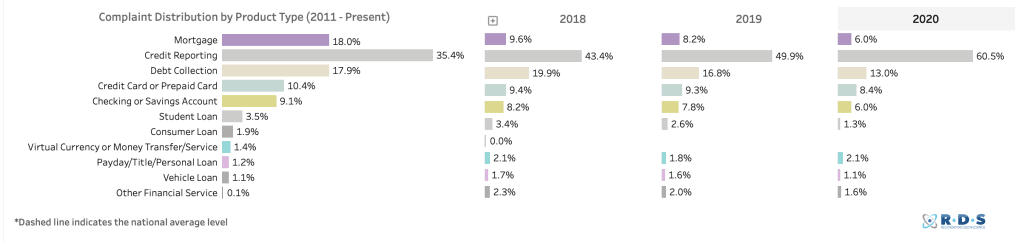
- Breakdown of product type (i.e. mortgage, debt collection)
- Source of complaint
- And if the consumer disputed the response
To summarize:
- There were 37,533 complaints in July, which is now the new highest, monthly total since 2011
- Between January of this year and the end of July, there has been a 43% increase in monthly complaints filed
- Since the program began, more than 1.7 million complaints have been filed
- Of all complaints filed, 97.8% are addressed on a timely basis, a level that remains unchanged from our previous update,
- As you can see in the table below, the vast majority of complaints filed with the CFPB are related to credit reporting.
Note that our complaint dashboard gets updated in real time.
CLICK HERE to see the interactive viz on the RDS Tableau Public page
Visit our ECONOMETRIX Hub Portal to see a wide variety of data visualizations on the U.S. economy.