Recovery Decision Science has updated its CFPB Complaints Dashboard on its Public Tableau page. The data is current through the end of July, 2022. The dashboard includes a company-by-company analysis of response times to complaints to the CFPB. Users can select a company from the pull-down menu. Then, using the dot-plot, you can compare that company to any of the more than 81,000 companies in the CFPB database in terms of timely response to complaints. As you work with the dot-plot, remember that blue is positive, meaning timely responses, and orange is negative. Users can also do a deep dive on a company’s performance relative to a number of factors:
- Total number of complaints
- Complaints over time
- Percent of complaints that are responded to in a timely manner (i.e. within 30 days)
- Breakdown of product type (i.e. mortgage, debt collection)
- Source of complaint
- And if the consumer disputed the response
Below is a screenshot of the Complaints Dashboard. Here is what we see through July, 2022: 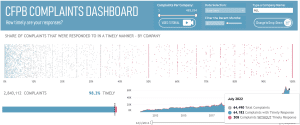
- In April consumer complaints spiked to an all-time high of 72,254. Complaints to the CFPB have been climbing since the earliest days of the pandemic. For perspective, there were a little less than 30,000 complaints in March, 2020, meaning we have had a 245% increase in complaints in a little over two years.
- The most recent report for July shows complaints at a little over 62,000, an 11% decrease since the April high-water mark.
- Of the 2.8 million complaints filed since reporting began in 2011, 98.3% have been resolved in a timely manner.
Next, we look at complaints by product type, as outlined in the screenshot below. Here’s what we learn: 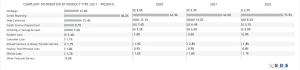
- Complaints related to credit-reporting continue to grow, now representing 73.5% of all complaints, up from 72% in our May report. This is an increase of 18.5% over 2021. The CFPB has identified “complaint response deficiencies of the Big Three Credit Bureaus” as the main culprit in the continued increases in credit reporting complaints. In a report published in January of this year, the CFPB said: “In 2021, Equifax, Experian and Transunion together reported relief in response to less than 2% of covered complaints, down from nearly 25% of covered complaints in 2019.”
- While complaints about mortgages are at an 11-year average of 13.6%, we see a continued reduction in mortgage-related complaints, which are now at 3.4% for 2022 to date.
To view the entire interactive CFPB complaints dashboard on RDS Tableau Public, CLICK HERE.
To learn more about Recovery Decision Science, contact:
Kacey Rask : Vice-President, Portfolio Servicing
[email protected] / 513.489.8877, ext. 261