Our BI Team Updates its CFPB Consumer Complaints Dashboard
Recovery Decision Science has updated its CFPB Complaints Dashboard on its Public Tableau page. The data is current through the end of May, 2022.
The dashboard includes a company-by-company analysis of response times to complaints to the CFPB. Users can select a company from the pull-down menu. Then, using the dot-plot, you can compare that company to any of the more than 81,000 companies in the CFPB database in terms of timely response to complaints. As you work with the dot-plot, remember that blue is positive, meaning timely responses, and orange is negative. Users can also do a deep dive on a company’s performance relative to a number of factors:
Total number of complaints
Complaints over time
Percent of complaints that are responded to in a timely manner (i.e. within 30 days)
Breakdown of product type (i.e. mortgage, debt collection)
Source of complaint
And if the consumer disputed the response
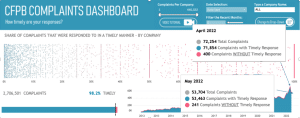
Below is a screenshot of the Complaints Dashboard. Here is what we see as of May, 2022:
In April consumer complaints spiked to an all-time high of 72,254, an increase of 21% from the previous month and 82% from April, 2021. Since November, 2021, there has been a steady rise in consumer complaints to the CFPB, hitting the peak in April. This increase most likely is tied to the fact that much of the government support and protection initiated during the pandemic (forbearance, support checks, etc.) have ended or are being peeled back.
Complaint volume fell nearly 26% between April and May, but still hovers at record highs.
Of the 2.7 million complaints filed since reporting began in 2011, 98.2% have been resolved in a timely manner.
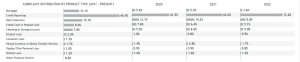
Next, we look at complaints by product type, as outlined in the screenshot below. Here’s what we learn:
Complaints related to credit-reporting continue to grow, now representing 72.6% of all complaints, up from 71% in March. This is an increase of 9 percentage points over 2021. The CFPB has identified “complaint response deficiencies of the Big Three Credit Bureaus” as the main culprit in the continued increases in credit reporting complaints. In a report published in January of this year, the CFPB said: “In 2021, Equifax, Experian and Transunion together reported relief in response to less than 2% of covered complaints, down from nearly 25% of covered complaints in 2019.”
While complaints about mortgages are at an 11-year average of 13.6%, we see a continued reduction in mortgage-related complaints, which are now at 3.6% for 2022 to date.
To view the entire interactive CFPB complaints dashboard on RDS Tableau Public, CLICK HERE.
To learn more about Recovery Decision Science, contact:
Kacey Rask : Vice-President, Portfolio Servicing
[email protected] / 513.489.8877, ext. 261