Several weeks ago, we published a post covering the first of a two-part series from the Federal Reserve on the impact of ending student loan forbearance, especially on different demographic groups.
In WHAT HAPPENS WHEN STUDENT LOAN FORBEARANCE ENDS we concluded that discontinuation of student debt forbearance will result in increased financial stress, especially for those demographic groups already facing hardship. Those who benefit from student debt forbearance expect a 16% chance of delinquency within three months if forbearance ends abruptly.
Today we break down the second part of the Fed’s series by creating a profile of those who borrow money for college, and how these borrowers would benefit from various, student loan forgiveness policy options.
WHAT FORGIVENESS OPTIONS COST
At the end of December, 2021, the outstanding balance for federally-funded student loans was $1.38 trillion, across 37.9 million federal borrowers.
The Fed studies two scenarios with regard to loan forgiveness:
- Limit forgiveness to $50,000 per borrower. Here is what we learn:
- The total cost would be $904 billion
- This level of forgiveness covers 29.9 million borrowers, or 79% of all federal loan borrowers.
- The $904 billion breaks down to $23,856 per borrower.
- The $50,000 threshold would forgive 77% of all federal loans that were delinquent or in default.
- Limit forgiveness to $10,000 per borrower. Here is what we learn:
- The cost: $321 billion.
- This would eliminate balances for 31.1% of all borrowers.
- The average borrower would receive $8,478 in loan relief.
- The $10,000 threshold would cancel 30,5% of loans that were delinquent or in default prior to the pandemic.
The analysis above showed the cost of forgiveness across all borrowers and income levels. To that end, the Fed wanted to see what would happen to the price tags for each option if we added in a layer of income eligibility.
Using Census data, the Fed simulated costs assuming that the household income limit was $75,000. The simulations showed:
- At the $50,000 forgiveness level, adding the income limit cut the price tag by 45%, from $904 billion to $507 billion.
- At the $10,000 level, the cost would drop from $321 billion to $182 billion.
WHO BENEFITS FROM LOAN FORGIVENESS
The series of charts below expand upon the previous section by looking at the benefits of loan forgiveness by different demographic profiles for each of the policy options.
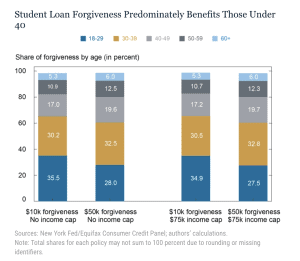
Age
With regard to age and loan forgiveness, here is what we see below:
- 67% of student loan borrowers are under 40, although only 57% of federal loan balances are held by those 40 and under. Meaning: older Americans tend to have larger balances, on average.
- Regardless of the plan or the income limits, about 60% of all forgiveness benefits those under 40.
- Moving from the $10,000 to $50,000 plan shifts a larger share of the forgiveness benefits to older Americans. For example, looking at the data without income caps, 16.2% of those 50 and older benefit from forgiveness at the $10,000 policy option. This benefit covers 18.5% of the same age group when we move to a $50,000 forgiveness level.
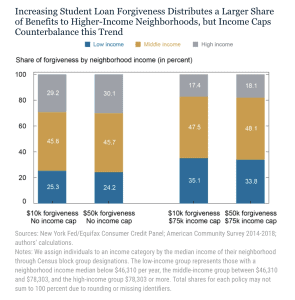
By Neighborhood Income
Using Census block group data, the Fed next looked at how the various policy options (with and without income limits) would benefit borrowers across low (median income: $46,310), medium ($46,310-78,303) and high ($78,303+) income neighborhoods. Here’s what the chart below shows us:
- In general (not shown on the chart), high income borrowers hold 33% of outstanding federal loan balances, despite representing only 25% of the population. Borrowers in low income group hold only 23% of the balances.
- Without income limits, borrowers in low income neighborhoods would receive about a quarter of all forgiveness dollars, while those in the upper income groups get about 30% of the benefit.
- But as you’ll see, when adjusting for a $75,000 income cap, the benefits shift significantly. She share of forgiven dollars drops from about 30% to around 18% for those in the upper income neighborhoods. By contrast, those borrowers in the lower income neighborhoods grow their share of benefits to about 34% with the higher income cap.
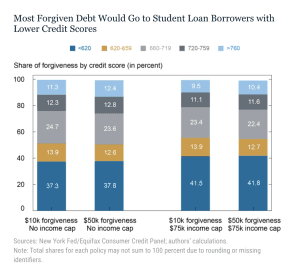
By Credit Score
Next, we look at how borrowers at various levels of financial stability would benefit from loan forgiveness. In this regard, the Fed looks at credit scores as a proxy for income and financial security.
Compared to the average U.S. adult, those with outstanding student loan balances tend to have lower credit score. Specifically, on a U.S. basis, a little over a third of all credit scores are above 360. But only 11% of student loan borrowers surpass the 750 super-prime credit score.
With regard to debt forgiveness in the chart below, here’s what we see:
- Across all four scenarios, more than half of all debt forgiveness falls to those with credit scores below 660.
- Moving from $10,000 to $50,000 in debt forgiveness (without income caps) slightly shifts the benefit to those in the upper credit groups.
- But as we adjust for income caps, we see a fairly substantial shift in benefits to those with credit scores below 660.
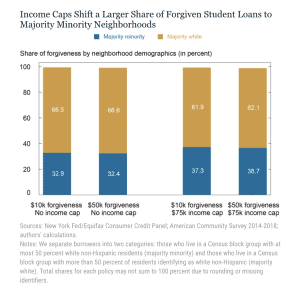
By Neighborhood Demographics
Finally, we look at the influence of neighborhood demographics on how the benefits of debt forgiveness are distributed. The analysis below breaks the population into two groups based on Census block data: neighborhoods that are either 50% majority white or 50% majority minority.
Overall, about 67% of the population and 67% of student loan borrowers live in majority white neighborhoods.
Here’s what the chart below shows us:
- At the $10,000 debt forgiveness level, the benefits between both demographic groups mirror the overall population, with about 67% going to those in majority white neighborhoods, and the balance benefitting those in majority minority neighborhoods.
- Increasing the amount of debt forgiveness has little impact on the relative benefits.
- However, when adding income caps, we see that, for both plans, there is a five-point shift in forgiveness benefits from majority-white to majority-minority households.
As we see in this post, the smaller student loan forgiveness policies tend to deliver slightly stronger benefits to those in lower income and majority minority groups. But adding the income gaps, while dramatically reducing the overall program costs, also increases the share of benefits to those borrowers who are most likely to face financial struggles.
SOURCE
To learn more about Recovery Decision Science’s Master Servicing capabilities, contact:
Kacey Rask : Vice-President, Portfolio Servicing
[email protected] / 513.489.8877, ext. 261