RDS has updated its extensive Unemployment Tableau Workbook based on the most recent data available.
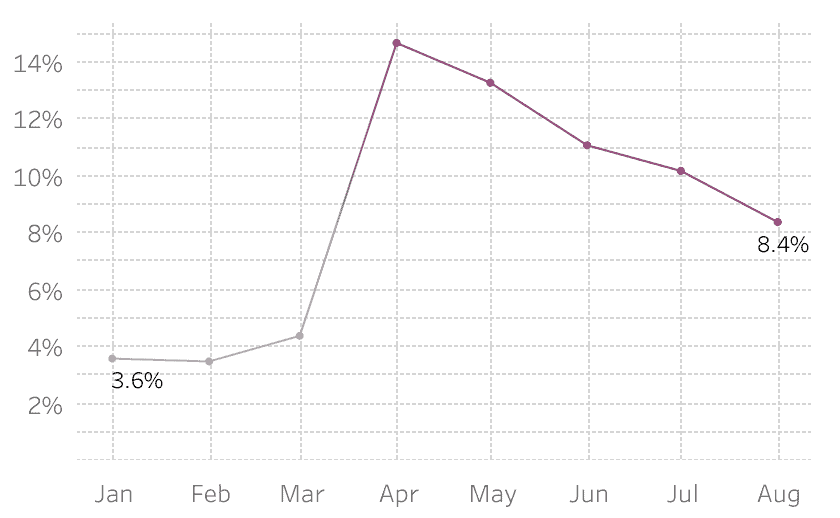
The national unemployment rate now sits at 8.4%, down 18% from July’s level of 10.2%. At the height of the lockdown in April, the unemployment rate stood at 14%. For context, we started the year at 3.6% in January.
Several highlights from this month’s report:
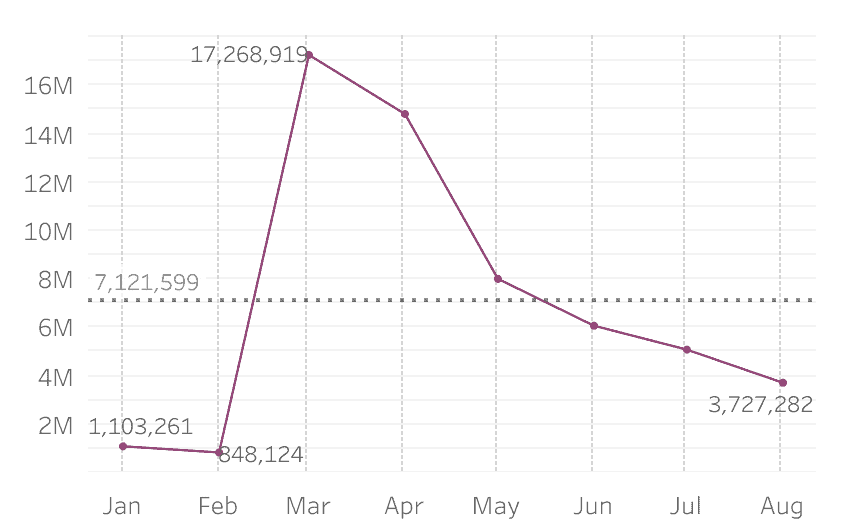
- Initial claims for unemployment stood at 3,727,282 at the end of August, down 27% against July’s level of 5,095,007. With lockdowns in place across most of the country, claims hit a peak of 17,264,919 at the end of March.
- Daily average unemployment claims for 2020 to date at 231.072, up 649% versus the daily average for 2019 of 30,831.
- The three states with the highest year-over-year Unemployment claims (compared to the U.S. average increase of 649%):
- Georgia: +1163%
- Florida: +979%
- New Hampshire: +691%
- The three states with the lowest year-over-year claims are:
- Oregon: -329%
- Pennsylvania: -303%
- Montana: -293%
- The three industries with the highest unemployment rates:
- Leisure and hospitality: 21.3% (down 15% vs. July)
- Transportation and utilities: 14.2% (up 3%)
- Mining, oil and gas exploration: 12.4% (down 21%)
- The three occupations with the highest unemployment rates:
- Food preparation and service: 22.3% (down 15% vs. July)
- Service occupations: 13.4% (down 17%)
- Personal care: 13.8% (down 23%)
CLICK HERE to see the complete Unemployment Workbook on RDS Tableau Public.