The Recovery Decision Science Business Intelligence team has been studying the labor market since the early days of the pandemic, with monthly updates to our interactive workbooks on Tableau Public.
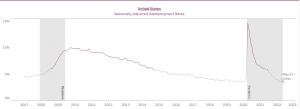
UNEMPLOYMENT RATE
For the most recent month, the unemployment rate dropped to 3.6%, reaching pre-pandemic levels (February 2020: 3.5%). At the end of 2021, the rate stood at 5.8%, having started the year at 6.4%. We entered 2022 with an unemployment rate of 4.0%. For perspective, the national unemployment rate in April 2020 hit 14.7%.
INITIAL UNEMPLOYMENT CLAIMS
Monthly unemployment claims are at 834,568, returning to pre-pandemic levels (February 2020: 848,233). For perspective, there were 17,240,178 unemployment claims in March 2020. Here is a breakdown of the daily average of unemployment claims over the past four years:
- 2022 (to date): 30,588
- 2021: 63,565
- 2020: 193,441
- 2019: 38,831
Let’s look at the breakdown by various groups.
Rate by Education Level:
- <High school diploma: 5.2%
- HS graduate with no college degree: 3.8%
- Some college/associate degrees: 3.4%
- Bachelor’s degree and higher: 2.0%
Rate by Race:
- Black or African American: 6.6%
- Hispanic: 4.3%
- White: 3.2%
- Asian: 2.4%
Rate by Industry (highest three):
- Leisure and hospitality: 5.1%
- Construction: Mining and Oil Exploration 4.1%
- Transportation and Utilities: 4.1%
NOTE: Leisure & Hospitality had the highest unemployment rate by industry in April 2020: 30.3%
Rate by Occupation (highest three):
- Production and Transportation: 4.6%
- Food Service: 4.8%
- Farming, Fish & Forestry: 5.1%
NOTE: Food Service had the highest rate by occupation in April 202: 41.8%
CLICK HERE to see the entire set of UNEMPLOYMENT WORKBOOKS.
To learn more about Recovery Decision Science Business Intelligence team contact:
Kacey Rask : Vice-President, Portfolio Servicing
[email protected] / 513.489.8877, ext. 261