The Recovery Decision Science Business Intelligence team has been studying the labor market since the early days of the pandemic, with monthly updates to our interactive workbooks on Tableau Public.
U.S. UNEMPLOYMENT
Here’s an overview of the reports.
INITIAL UNEMPLOYMENT CLAIMS
Monthly unemployment claims are at 855,896, returning to pre-pandemic levels (February 2020: 848,233). For perspective, there were 17,240,178 unemployment claims in March 2020. Here is a breakdown of the daily average of unemployment claims over the past four years:
- 2022 (to date): 33,182
- 2021: 63,565
- 2020: 193,441
- 2019: 38,831
UNEMPLOYMENT RATE
For the most recent month, the unemployment rate dropped to 3.8%, again, reaching pre-pandemic levels (February 2020: 3.5%). At the end of 2021, the rate stood at 5.8%, having started the year at 6.4%. For perspective, the national unemployment rate in April 2020 hit 14.7%.
Let’s look at the breakdown by various groups.
Rate by Education Level:
- <High school diploma: 4.3%
- HS graduate with no college degree: 4.5%
- Some college/associate degrees: 3.8%
- Bachelor’s degree and higher: 2.2%
Rate by Race:
- Black or African American: 6.6%
- Hispanic: 4.4%
- White: 3.3%
- Asian: 3.1%
Rate by Industry (highest three):
- Leisure and hospitality: 6.6%
- Construction: 6.7%
- Agriculture: 9.4%
NOTE: Leisure & Hospitality had the highest unemployment rate by industry in April 2020: 30.3%
Rate by Occupation (highest three):
- Construction: 7.4%
- Building management: 7.3%
- Farming, Fish & Forestry: 11.0%
NOTE: Food Service had the highest rate by occupation in April 202: 41.8%
CLICK HERE to see the entire set of UNEMPLOYMENT WORKBOOKS.
JOB OPENINGS AND LABOR TURNOVER
As a complement to the Unemployment workbook, and to provide context for what has become known as the “Great Resignation,” our BI team developed a second set of Tableau workbooks: JOB OPENINGS AND LABOR TURNOVER.
The workbook covers three areas:
The Job Opening Rate
A job is considered “open” if it meets all three of the following variables:
- A specific position exists (full or part-time) and there is work available for that position.
- The job could start within 30 days.
- The employer is actively recruiting from outside the organization.
The most recent data is from December 2021, which shows the open job rate at 7.1%, a slight increase over November. Let’s look at the sectors with the three-highest job open rates:
- Leisure & Hospitality: 11.7%
- Professional and Business Services: 8.5%
- Education & Health Services: 8.4%
Hires vs. Separations
One of the most telling statistics to put context around the Great Resignation is the relationship between hires and separations. Let’s define each:
- Hires include all additions to the payroll during the reference month, such as newly hired or newly rehired employees.
- Separations reflect all separations from the payroll: quits, layoffs, discharges and other separations, not including retirements.
Below is a screenshot of the current workbook.
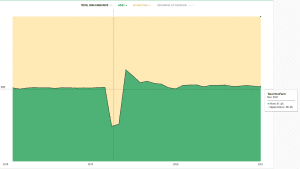
As you can see, the current there is a five-point gap between the hiring rate (52.5%) and the separation rate (47.5%). For perspective, in April 2020 the hiring to separation rate stood at 25.8%/74.2%.
Unemployed People vs. Job Openings
Finally, we look at the relationship between the number of unemployed people and the current number of job openings. Below are two charts, looking at this from both a raw number and percentage perspective.
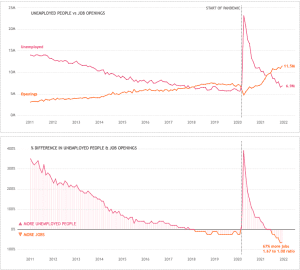
As we see, currently there are 67% more jobs than there are unemployed people. But, for perspective, when we look at the early months of the pandemic, we see that there were 390% MORE unemployed people than there were available jobs.
To learn more about Recovery Decision Science contact:
Kacey Rask : Vice-President, Portfolio Servicing
[email protected] / 513.489.8877, ext. 261