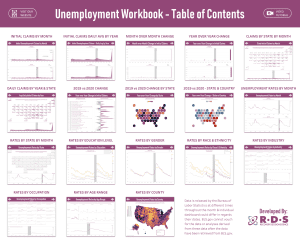
In the early months of the pandemic, the Recovery Decision Science Business Intelligence team launched an Unemployment workbook on its Tableau Public page. As we see from the screenshot below, the workbook includes 18 interactive data visualizations covering U.S. unemployment from various angles. We’ve continued to update and report on the unemployment story over the past year and a half. CLICK HERE if you’d like to take a closer look at the workbook.
Rightly, we focus tremendous energy on the unprecedented unemployment levels in the early months of the COVID-19 lockdowns. Industries such as food service saw unemployment climb to more than 45 percent at its peak. As the economy has recovered, the unemployment rates have improved but are still above pre-pandemic levels. Nationally, unemployment is nearly a point above the historic low of 4.4 percent seen in March 2020. Food service industry unemployment levels have dropped, but today are TWICE the pre-pandemic low of 4.8 percent. While unemployment reporting is most common, another critical labor statistic has received little attention over the years, at least until recently, and that is labor force participation (LFP). The focus on unemployment has now shifted to worker shortages, especially in low-wage service industries such as food service, entertainment, and retail. LFP is an essential part of the worker shortage story.
LABOR FORCE PARTICIPATION DEFINED
According to the U.S. Bureau of Labor Statistics (BLS), the LFP combines those who are both employed and unemployed, defined as such:
- THE EMPLOYED: People with jobs are considered “employed” and range from those who are full-time to part-time, or temporary/seasonal to year-round.
- THE UNEMPLOYED: People who are jobless, available to work, and have looked for a job in the past four weeks.
Some groups aren’t classified in either category and, thus, are not included in the labor market:
- Those who would like to work but have stopped searching for work.
- Many students and retirees are not officially in the labor force.
- Despite the importance of their roles, stay-at-home parents are not considered part of the labor force.
- Those with disabilities who haven’t worked or looked for work.
HOW DOES THE UNEMPLOYMENT RATE DIFFER FROM THE LFP RATE?
According to Investopedia:
- The unemployment rate defines the percentage of people in the labor force who don’t have jobs but actively seek employment.
- The LFP rate refers to the percentage of people age 16+ who are in the labor force.
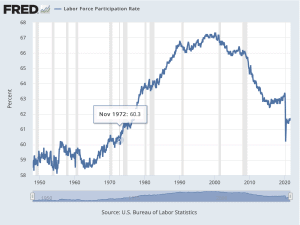
The chart below from the Federal Reserve of St. Louis looks at LFP rates dating back to the 1950s. Some noteworthy points to consider:
- The LFP rate began to rise dramatically in the mid-60s and early-70s. This increase is almost entirely a function of women entering the workforce, particularly married women.
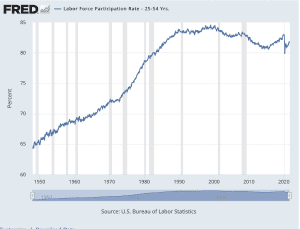
- The peak LFP rate was in March 2000 at 67.3 percent. Concerning those in prime working years (adults 25-54), the LFP was about 85 percent, with women at 74 percent and men at 93 percent, respectively. (SEE SECOND CHART BELOW).
- The LFP dropped to 64.6 percent in December 2009, as the Great Recession ravaged the economy.
- After hitting a 37-year low of 62.4 percent in 2015, the LFP began to creep back up, hitting 63.3 percent in February 2020.
- While driving unemployment rates to all-time highs, the pandemic also drove LFP rates down, hitting 60.2 percent in April 2020. You’d have to go back to November 1972 to find an LFP rate at this low of a level.
- The LFP has slightly rebounded, now standing at 61.6 percent in September 2021. But still, the rate is well below the all-time high seen in 2000.
THE PANDEMIC, THE WORKFORCE, AND THE ECONOMY
As we saw from the first chart above, the LFP rate peaked in 2000, then started a long, gradual decline that didn’t level off until 2015. That gradual decline was primarily fueled by aging Baby Boomers who began to retire and permanently leave the workforce. The Great Recession played a role in this decline, but it’s more about the shifting (and aging) demographics. Then the pandemic hit! COVID-19’s impact on the labor force was devastating, as we saw by the unprecedented levels of unemployment in the months following the economic shutdown. But while unemployment levels have (somewhat) stabilized, leaving over 9 million people technically out-of-work, there are still an estimated ten million+ U.S. jobs looking to be filled. There are several factors we can use to explain this seeming contradiction:
- The Great Retirement: The Baby Boomer retirement trend in the early 2000s shifted into high gear during the pandemic. According to Pew Research, more than 30 million Boomers retired in the 3rd quarter of 2020. A separate study by Coventry showed that 79 percent of Boomer respondents have decided to retire early.
- The Great Resignation: The BLS reports that more than 4 million Americans resigned from their jobs in July 2021 alone. The highest percentage of these resignations came among mid-career employees, who perhaps delayed transitioning to a new role because of the pandemic. Or, maybe they were just burned out because of psychological factors tied to the pandemic.
- The Great Reassessment: An extension of the Great Resignation is that millions of Americans have used the pandemic to reassess their life choices. For many, this reassessment period was made easier by the healthy unemployment benefits gained by governmental support programs like the CARES Act. In particular, those in the low-paying service industries have used this time of reassessment to look for more rewarding work and, indeed, better pay.
Combined, these factors can continue to depress the LFP rate and hurt the economy. A few examples of this impact include:
- It will be difficult for small businesses to match the wage and benefits power of larger organizations. As such, many will be forced to shutter or, at best, limit their hours and offerings to stay whole.
- Lower LFP rates can drag down the GDP as fewer people contribute to the country’s output of goods and services.
- Also, a lower LFP could mean a lower tax base for local communities, precipitating the need to raise taxes.
SOURCE
https://fred.stlouisfed.org/series/CIVPART
https://www.nytimes.com/2021/04/16/upshot/unemployment-pandemic-worker-shortages.html
To learn more about Recovery Decision Science’s Business Intelligence Team, contact:
Kacey Rask : Vice-President, Portfolio Servicing
[email protected] / 513.489.8877, ext. 261