When it comes to collecting on an outstanding debt or dormant judgment, any collections professional knows that the two most important variables predictive of a consumer’s ability to pay are current employment and home ownership.
AMERICA IS GETTING BACK TO WORK
As we outlined in a recent post OUR BI TEAM LOOKS AT THE LABOR MARKET, the U.S. employment situation is getting back to normal after the pandemic.
- Claims for new unemployment benefits are now at pre-pandemic levels.
- The national unemployment rate has dropped below 4% (3.6% as of Mar 2022). At the end of 2021, the rate stood at 5.8%.
So, the headline for the collections industry is simple: more Americans are employed, and bringing home healthier paychecks, giving them a much greater chance to meet their debt obligations.
HOME VALUES CONTINUE TO SOAR
While employment has stabilized, the U.S. housing market continues to grow, pushing home prices to their highest levels ever.
RDS recently launched a new dashboard on our Tableau Public page looking at home prices over time. The new dashboards complement our growing portfolio of Tableau dashboards, all of which provide economic insights and industry trends that RDS leverages to assist in recoveries.
To learn more about the new dashboards, check out our recent post: OUR BI TEAM LOOKS AT RISING HOME PRICES.
Here are several noteworthy facts from that post:
As of March, the average U.S. home sold for $524K, which is:
- 15% higher than at the end of last year.
- Nearly 40% higher than prices at the start of the pandemic.
- Nearly 84% higher than average home prices at the start of the Great Recession.

Most experts agree that prices will continue to increase, at least through 2022, despite increasing interest rates.
- According to the Federal Reserve, there were about 1,000,000 homes listed for sale in January 2020. As of January 2022, the number of new listings dropped to a little over 400,000.
- Freddie Mac estimates that new home construction is about 3 million homes short of demand from would-be buyers. Realtor.com pegs the new construction supply gap at 5.8 million homes.
It’s also worth noting that, in addition to rising home prices, Americans are sitting on an estimated $10 trillion in accessible home equity according to data from Investopedia. Meaning: the amount owners could cash out with a new mortgage.
In fact, according to ATTOM’s 2021 U.S. Home Equity and Underwater Report, as of the end of Q4 2021, 41.9% of mortgaged residential properties in the U.S. are considered “equity rich” meaning: the combined estimated amount of loan balances secured by those properties was no more than 50% of the estimated market value.
At the same time, according to Core Logic, negative equity fell by 24.9% as Americans used government subsidies to pay down their debt, while also reaping the benefits of rising home prices.
BUT…NOT ALL HOMES ARE EQUAL!
Intuitively we understand the precept that not all homes are equal, especially as relates to objective comparisons of homes based on something everyone understands: sale price.
But until now, there has never been a way to qualitatively compare one real estate property to another. That’s why RDS created Paymetrix RE, a revolutionary advancement for the collections industry, where accurately estimating a home’s value can play such an outsized role in suit-decisioning.
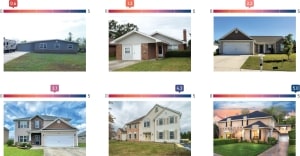
Paymetrix RE is a proprietary property-scoring algorithm that accurately determines the quality and value of a home, based on actual images of the property and surrounding properties. Homes are scored on a 5-point scale, employing nationwide real estate data from more than 155 million U.S. properties.
As a reference point, the average U.S. home has a Paymetrix RE score of 1.6. Below, you’ll see a cross-section of homes covering the full range of RE scores:
Machine-learning builds the RE algorithm beginning with actual images of the property of interest. The program then progresses by evaluating street-level images from all surrounding properties. Below is a sample schematic.
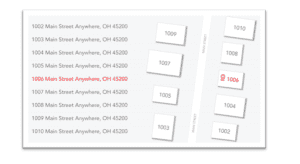
The power of the RE algorithm is that it puts the target property in a much broader context, i.e. an entire neighborhood. In other words, looking at the other properties in the neighborhood helps to validate our target home’s quality and value, thus creating a more accurate RE score for suit decisioning.
PUTTING IT TOGETHER
Below is an illustration from a case study using a sample of 50,000 previously-litigated accounts from a major, national creditor. The outcome from Paymetrix RE is compared to the expected results of a random-sample, where litigating 30% of the accounts would yield 30% of the profits:
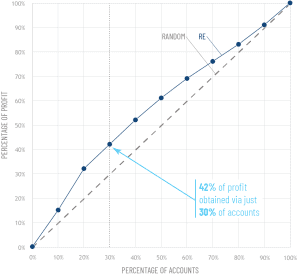
As you can see, Paymetrix RE returned 42% of the profits compared to the benchmark, a lift of 12 points, or 40% more profit on the same number of accounts.
But let’s take a closer look to provide more context.
With the 50,000 accounts mentioned in the case study above, the FIRST PASS for RDS was to assign a “profitability index” using Paymetrix PI. Accounts with a high profitability index were recommended for legal collections. Notably, the bulk of these high PI accounts was in states with reasonable court costs, such as Maryland and Virginia.
RDS then layered in Paymetrix RE and was able to reveal high-profit gems that PI alone could not identify. For example:
- An account in Texas had an outstanding balance of $40,000 and an extremely low profitability index of .9. So, suing to collect would not make sense because of the state’s high legal costs. But by running Paymetrix RE, RDS discovered the same account owned a property with a RE score of 3.2(twice the national RE average of 1.6). Thus, RE dramatically changed the equation with regard to a suit decision on this account.
Paymetrix RE provides a fast and cost-efficient way to score the quality of homes. Because consumers living in higher-quality homes are, on average, more likely to pay, RE allows banks and creditors to better prioritize their account decisions.
To learn more about Paymetrix RE, or the entire suite of Paymetrix products, contact:
Kacey Rask : Vice-President, Portfolio Servicing
[email protected] / 513.489.8877, ext. 261
SOURCES
https://www.investopedia.com/average-equity-in-u-s-homes-5270147