Since the early days of the pandemic, the Recovery Decision Science Business Intelligence team has been tracking various aspects of the economy through interactive data visualization dashboards on our TABLEAU PUBLIC PAGE.
Our dashboards include:
- Unemployment Claims and Rates
- Job Openings and Labor Turnover
- S. Home Sales
- Mortgage Rate Trends
- Mortgage Application Trends (New and Refinance)
- Median Rent by County
- Consumer Loan Charge-Off Rates
With this post, we launch another interactive dashboard that breaks down trends in HOUSING PRICES.
As we discussed in a recent blog post, Our BI Team Looks at the Real Estate Market, general measures of real estate vitality have been trending downward in recent months:
- Mortgage rates are rising, hitting 5.1% at the end of April 2022
- Home sales were down 5% since the start of the year.
- Mortgage applications are down significantly this the start of the year:
- New home mortgages -15%
- Refinance mortgages -56%
But what about home prices?
As our new DASHBOARDS reveal, home prices continue their healthy growth trends.
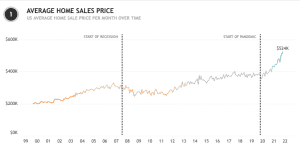
The first chart below looks at average home sales prices dating back to 2000. As of March the average home sold for $524K, which is:
- 15% higher than at the end of last year.
- Nearly 40% higher than prices at the start of the pandemic.
- Nearly 84% higher than average home prices at the start of the Great Recession.
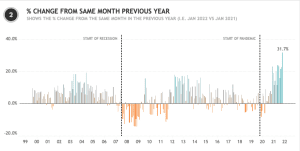
Next, we look at year-over-year price changes by month (comparing a month to that same month in the previous year). The current home price of $524K in March 2022 is up 31.7% versus March 2021. And, as we look at the chart below, we see huge spikes in percentage change since the start of the pandemic.
- For perspective, the largest year-over-year increase outside of the pandemic was from October ’20 to October ’21: 23.7%
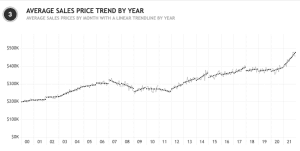
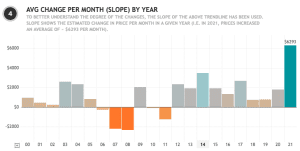
Finally, the remaining two charts in the home price workbook look at the same pricing trends from two different angles:
- Dashboard 3 looks at average sales price by month with a linear trend line by year.
- Dashboard 4 shows the average change by month, or slope.
As you can see,
- For 2021, home prices increased, on average, a staggering $6,293 per month. This is nearly double the next highest average of $3,493 seen in 2014.
- And, again, looking back at the Great Recession, the average home price FELL by $2,319 in 2008.
Where will home prices go from here?
Most experts agree that prices will continue to increase, at least through 2022, despite the prospect of higher interest rates.
- According to the Federal Reserve, there were about 1,000,000 homes listed for sale in January 2020. As of January 2022, the number of new listings dropped to a little over 400,000.
- Freddie Mac estimates that new home construction is about 3 million homes short of demand from would-be buyers. Realtor.com pegs the new construction supply gap at 5.8 million homes.
Look for updates in this blog in future months.
Again, check out our interactive dashboard on home prices HERE.
SOURCE
https://fortune.com/2022/02/17/historic-housing-shortage-more-pain-homebuyers/
To learn more about Paymetrix RE, or the entire suite of Paymetrix products, contact:
Kacey Rask : Vice-President, Portfolio Servicing
[email protected] / 513.489.8877, ext. 261