In April 2015, we introduced an interactive dashboard that broke down CFPB across a variety of metrics (by state, by type of complaint, etc)
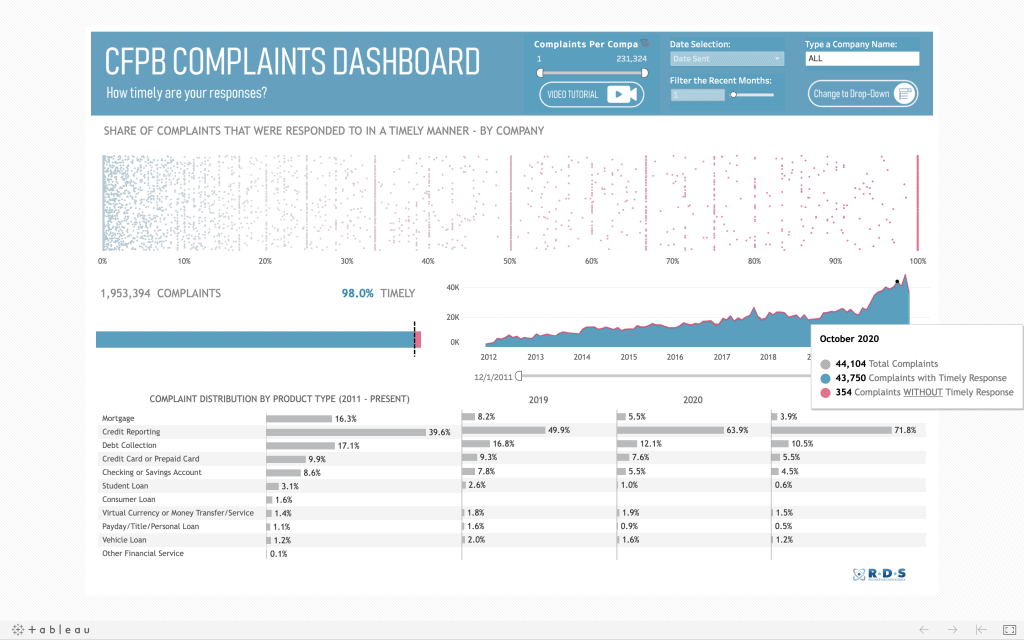
We have since updated the dashboard and published it here for the first time. The updated interactive dashboard now includes a company-by-company analysis of response time to complaints to the CFPB. You can select your company from the pull-down menu. Then, using the dot plot, you can compare it to all of the companies in the CFPB database in terms of timely response to complaints. As you look at the dot plot, remember that blue is good and orange is bad.
You can also do a deep dive on your company’s performance relative to a number of factors:
- Total number of complaints
- Complaints over time
- Percent of complaints that are responded to in a timely manner
- Breakdown of product type (i.e. mortgage, debt collection)
- Source of complaint
- And if the consumer disputed the response
Here are a few top line highlights from the current CFPB report:
- The high mark for monthly consumer complaints was 15,564 in August of 2015. This represented a nearly 7-fold increase since the first month that complaints were recorded in December, 2011.
- 98% of all complaints are handled on a timely basis
- Nearly 2/3 of complaints come to CFPB through the web
- Nearly 80% of consumer complaints are handled without dispute
We will continue to update this dashboard and post the results on a regular basis.
CLICK HERE to go to the interactive CFPB Complaint Dashboard.