In our previous post, we discussed how the Federal Reserve Bank of New York measures first-time home buyers, and in our second part, we describe characteristics of first-time buyers and how those characteristics change over time, again using Fed data.
The success in transitioning from renting to owning depends on a buyer’s ability to manage the financial obligations required to purchase a house, as well as their credit score. The two primary financial costs of owning a home are the initial down-payment and monthly mortgage payments, so each of these costs relates to the size of the mortgage required for purchase.
The chart below shows the average origination mortgage balances for first-time and repeat buyers. As it displays, at the start of the 2000s, average origination mortgage balances for these two types of buyers were similar.
In 2001, the average origination mortgage balance for first-time buyers was $128,000, or 84 percent of the average for repeat buyers of $152,000. Rapidly rising house prices during the housing bubble pushed up mortgage balances for repeat buyers more than for first-time buyers. From 2003 to 2006, the average origination mortgage balance for repeat buyers increased by $68,000, or 13 percent per year. In contrast, over this same period, the average origination mortgage balance for first-time buyers increased by $33,000, or eight percent per year. By the onset of the housing bust in 2006, the average origination mortgage balance for first-time buyers had fallen to 75 percent of that for repeat buyers.
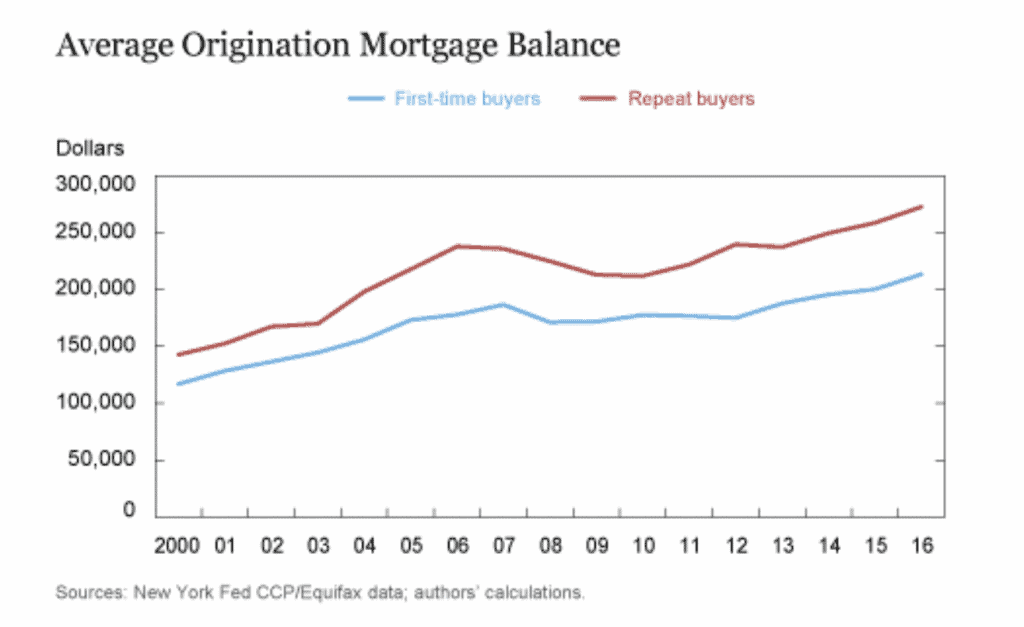
As in the case of the housing boom, the housing crash affected repeat buyers to a greater extent than first-time buyers. From its peak of $238,000 in 2006, the average origination mortgage balance for repeat buyers declined for three years, reaching its nadir of $212,000 in 2009. For first-time buyers, the average origination mortgage balance peaked at $186,000 in 2007 and declined for just one year to $171,000 in 2008. Over the next four years, the average origination mortgage balance for first-time buyers changed very little.
After 2012, as house prices recovered, the average origination mortgage balance for first-time buyers resumed its upward trend. Over the period from 2000 to 2016, the average origination mortgage balance for first-time buyers rose by 84 percent as compared with 92 percent for repeat buyers. In 2016, the ratio of first-time to repeat buyer average origination mortgage balances was 78 percent, similar to its earlier 2007 value.
A second important factor determining a borrower’s ability to obtain a mortgage to purchase a house is the buyer’s credit score. In our next chart, we compare the average credit scores of first-time buyers and repeat buyers.
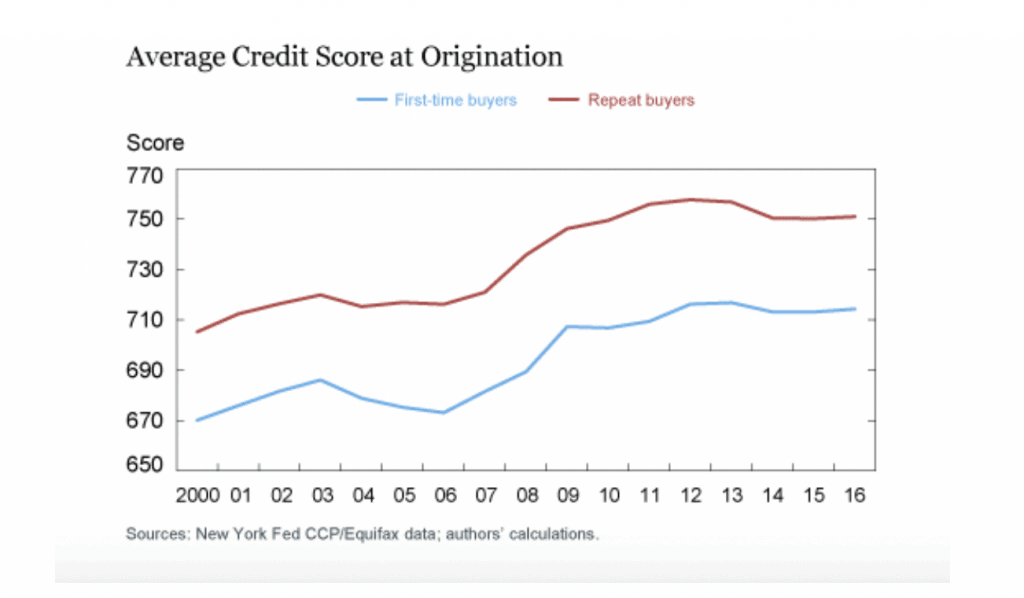
Not surprisingly, average credit scores for repeat buyers consistently exceed those of first-time buyers. In 2000, the average credit score for first-time buyers was 670, and for repeat buyers, it was 705—a spread of 35 points.
As the housing boom intensified after 2003, the average credit score of first-time buyers declined slightly from 686 to 673, while for repeat buyers it was virtually unchanged. Starting in 2007, as house prices began to decline and mortgage defaults increased, the average credit quality of both first-time and repeat buyers resumed its upward trend. This trend continued until 2013, when the average credit score of first-time buyers reached 717, while for repeat buyers it reached 757.
Note that in 2016, the spread between the average credit scores was 37 points—essentially unchanged from 2000.
In our next post, we will address the growing concern over the student loan debt crisis and how that may be crowding out first-time homebuyers.
SOURCE
https://libertystreeteconomics.newyorkfed.org/2019/04/a-better-measure-of-first-time-homebuyers.html