This is the third and final post in our series examining the Federal Reserve’s recent study on gender and racial differences in measuring household debt. If you haven’t read the first two posts, here are the links:
As you would see if you read these first two posts, the Fed had to create a unique model for estimating both debt and delinquency outcomes. For convenience, we’ve provided the explanation for their model below.
RESEARCH METHODOLOGY
There is plenty of information about the volume of household debt in the aggregate. But when it comes to looking at household debt for narrower demographic segments of the population, we have little to no reliable data. So, the research team at Liberty Street had to get creative.
To develop the data used in this series, they “linked anonymized educational and demographic data of first-time freshman students enrolled at the City University of New York (CUNY is the largest urban college system in the country) with the students’ anonymized household debt data from the New York Fed/Equifax Consumer Credit Panel. This unique data set allows analysis of debt by race and gender of CUNY students born between 1942 and 1988.”
To provide deeper context, the researchers divided the student population into those who pursued two-year associate degrees (AA) and four-year bachelor’s degrees (BA). Each chart below reflects these groupings, with AA student data on the top panel and BA below.
Finally, all data is based on debt accrued by age 30 for all the measured groups
OVERVIEW
Here is a summary of the findings from the first two parts of the Fed’s debt and delinquency series:
- Black and Hispanics took on less mortgage, credit card, and auto debt by age 30 than their white counterparts, but experienced higher levels of delinquency across all of these credit types.
- Black students, however, took on more student loan debt than white students, with higher levels of delinquency in paying back their student loans.
- The trends in both taking on debt and delinquency were reversed when we look at Asian students vis-à-vis white students.
- With regard to gender, women were less likely than men to have either a car loan or mortgage, but more likely to have student debt by age 30. The rate of delinquencies between women and men was not statistically significant.
In trying to understand some of the debt and delinquency differences outlined above, the Fed theorizes that gender and racial disparities in labor market outcomes might be a reasonable explanation. However, they do not have data on labor market outcomes for the CUNY samples discussed in the methodology section above. So, they made another adjustment to the data, as outlined below:
“We consider education outcomes as a proxy for labor market outcomes drawing on the overwhelming evidence in favor of a strong linkage between education and labor market outcomes. In this post, we leverage administrative data on demographic and educational outcomes from an anonymized data set of all first-time freshman students enrolled with CUNY between 1999 and 2014.”
The charts below, as with the two previous posts, are broken out by those seeking associate degrees (AA) or bachelor’s degrees (BA). But with regard to using education as a proxy, the study looks at two educational outcomes by gender and race:
- The graduation rate in their intended degree (AA or BA) by age 30.
- Student GPA at the end of their expected time to earn a degree (2 or 4 year).
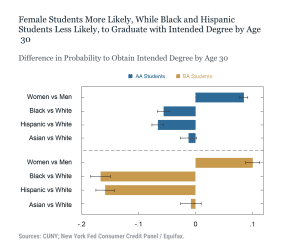
GRADUATION RATE
In the Fed’s CUNY sample, 25 percent of AA and 52 percent of BA students attained their intended degrees by age 30. These rates are consistent with what we would see from a national sample. In looking at the chart below, we see the following:
- Female AA students were 8.5 percentage points MORE LIKELY than their male counterparts to graduate by age 30. The gap grows to 10 percentage points at the bachelor level.
- Black and Hispanic AA students were respectively 5.6 percentage points and 6.6 percentage points LESS LIKELY to graduate by age 30 than White students.
- The racial gap grows significantly when we move to BA students. Specifically, Black and Hispanic students were 17 and 16 percentage points, respectively, less likely to graduate by age 30 than white students.
- There is NO statistically-significant difference in educational attainment when we compare Asian to White students at both degree levels.
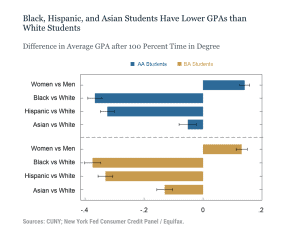
LOOKING AT GRADES
The second proxy in the Fed’s methodology for estimating labor market outcomes was grades. Specifically, the chart below looks at the cumulative grade point average (GPA) attained by the fourth semester for AA students and eight semesters for BA students. As we see in looking at the chart:
- Women had higher GPAs than men in both degree categories. Specifically, this amounted to 0.14 and 0.13 points, respectively, for AA and BA students.
- With regard to racial differences, the gaps are significant when comparing both Black and Hispanic students to their White peers. The Black-White gap was 0.37 points for both AA and BA students. The Hispanic-White gaps were 0.32 and 0.33 points for AA and BA students respectively.
- As we’ve seen through this study, there was only a marginal difference between the GPA performance of Asian students relative to their white peers.
To learn more about Recovery Decision Science’s Business Intelligence Team, contact:
Kacey Rask : Vice-President, Portfolio Servicing
[email protected] / 513.489.8877, ext. 261