The housing market continues to hum along, bolstered by continuing, record-low mortgage rates.
The RDS Business Intelligence team recently updated its Econometrix Tableau real estate workbooks.
Here’s an overview of what you’ll see when you link to our TABLEAU PUBLIC PAGE.
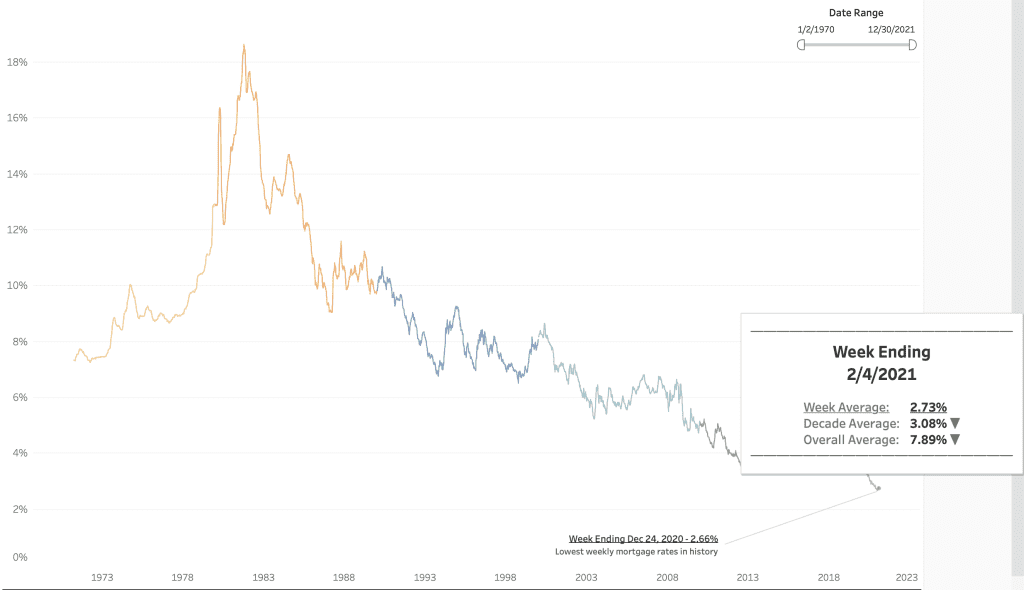
MORTGAGE RATES
As of February 5, the 30-year fixed mortgage rate sits at 2.73%, which is effectively in the same range as it’s been for the past month. To put the last year in perspective, our Tableau viz breaks down 30 year fixed rates for the past FIVE decades, summarized below:
- 2020s: 3.06%
- 2010s: 4.09%
- 2000s: 6.29%
- 1990s: 8.12%
- 1980s: 12.70%
- 1970s: 8.90%
MORTGAGE APPLICATIONS
The Mortgage Bankers Association (MBA) reports weekly on two types of mortgage applications:
- MBA Purchase Index: The Purchase Index is a leading indicator of home sales by 4-6 weeks, meaning that it is a predictor of housing activity. Housing economists and home builders use the index to forecast new and existing home sales.
- MBA Refinance Index: The Refinance Index is a tool to predict mortgage activity. Homebuilders pay attention to the Refinance Index because it is a leading indicator of home sales. On the other hand, mortgage investors also take notice of the index as it is a leading indicator of mortgage pre-payment activity.
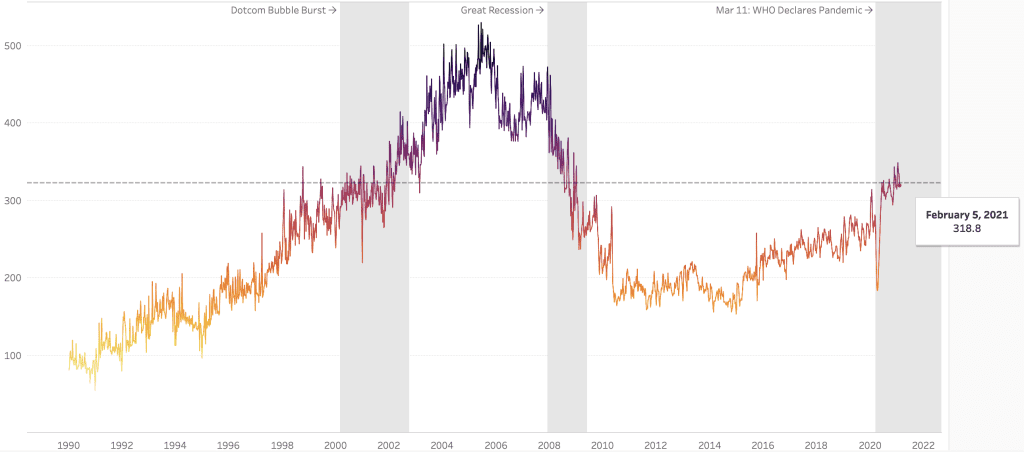
MBA Purchase Index
The most recent Purchase Index sits at 318.8. This is down 8% from the 12-month peak of 348.2 in January. But it is 75% higher than the 12-month low of 182.6, in April, 2020. Since September, 2020, the Purchase Index has hovered above 300, a level that has not been seen since the summer of 2008.
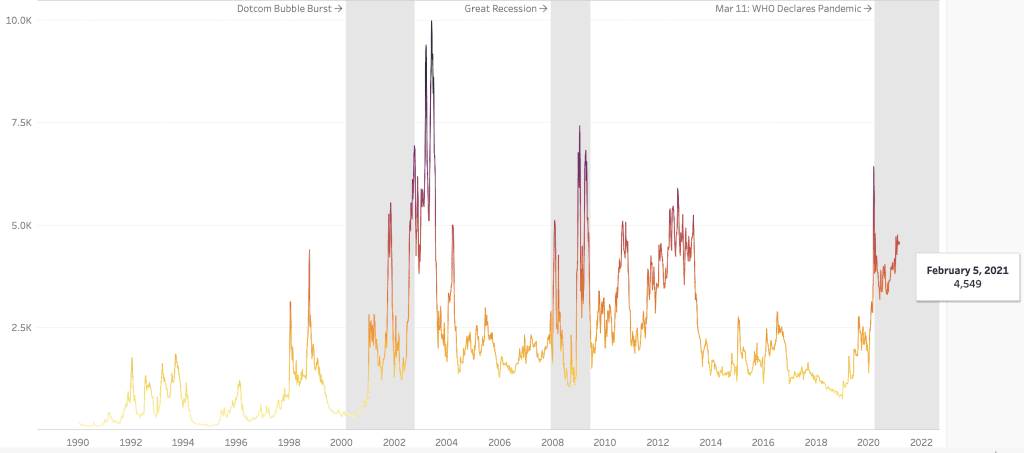
MBA Refinance Index
The most recent Refinance Index stood at 4,549, down 29% from 6,419 in March, 2020-which was an 11-year high. The current Refinance Index is up 59% from April’s 12 month low of 2,853.
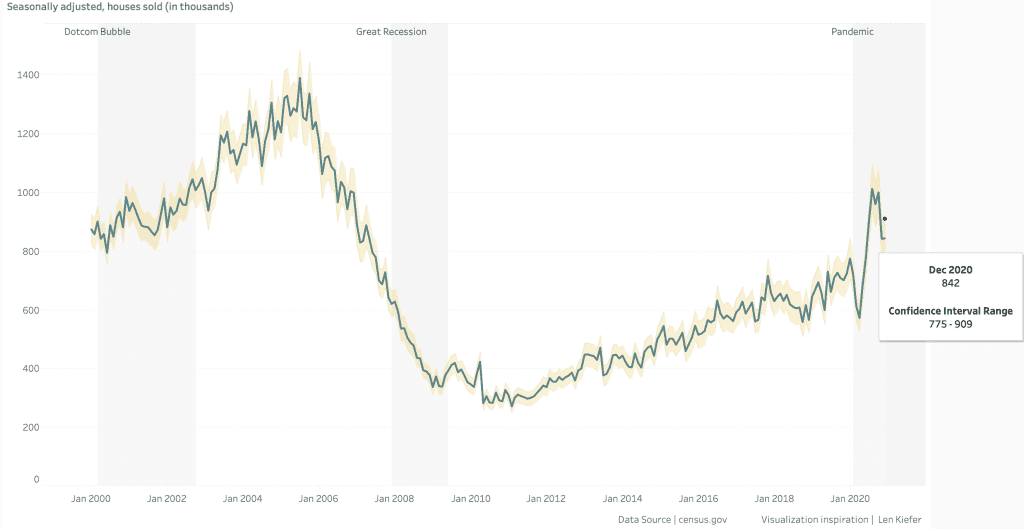
HOME SALES
As go interest rates, so goes home sales. Seasonally-adjusted home sales hit 842,000 for the most recently updated month, December; the same level reached in November. This is down 17% from the 1,011,000 homes sold in August, a level not seen since November, 2006. December’s home sales were up 47% versus the 12-month low of 571,000, hit in April. And while December units are down versus the August high, it is worth noting that we would need to go back to May, 2007, to see seasonally-adjusted home sales hit the 842,000 range.
Again, for an interactive look at all of topics discussed above, as well as other aspects of the U.S. economy, visit our TABLEAU PUBLIC PAGE.
To learn more about Recovery Decision Science contact:
Kacey Rask : Vice-President, Portfolio Servicing
[email protected] / 513.489.8877, ext. 261