This is the second in a series of posts covering a report by the Federal Reserve on racial, gender, and educational differences in household debt reporting. In last week’s post, we looked at Household Debt Inequality by Race, Gender, and Education. Today we focus on economic inequalities with regard to delinquency. We start, as we did with the first post in the series, by looking at the unique methodology the Fed used in developing their data.
RESEARCH METHODOLOGY
There is plenty of information about the volume of household debt in the aggregate. But when it comes to looking at household debt for narrower demographic segments of the population, we have little to no reliable data. So, the research team at Liberty Street had to get creative.
To develop the data used in this series, they “linked anonymized educational and demographic data of first time freshman students enrolled at the City University of New York (CUNY is the largest urban college system in the country) with the students’ anonymized household debt data from the New York Fed/Equifax Consumer Credit panel. This unique data set allows analysis of debt by race and gender of CUNY students born between 1942 and 1988.”
To provide deeper context, the researchers divided the student population into those who pursued two-year associate degrees (AA) and four-year bachelor’s degrees (BA). Each chart below reflects these groupings, with AA student data on the top panel and BA below.
Finally, all data is based on debt accrued by age 30 for all the measured groups
STUDENT LOAN DELINQUENCY
As we wrote last week, women and Black students were more likely to take out student loans, and in higher amounts, than men and white students. Asian and Hispanic students (with the exception of Hispanic BA students) tended to take on less student loan debt. As we look at the chart below, we find that female AA and BA students were less likely ever to be delinquent on their student loans compared to male students. Specifically, female AA students were 3.1 percentage points less likely than their male AA counterparts to be delinquent. This gap narrows to 1.5 percentage points for BA students. When we look at race, the numbers become more dramatic when comparing both Black and Hispanic students to white students:
- Black AA students were 12 percentage points more likely to be delinquent than their White AA counterparts. At the bachelor level, this delinquency gap grows to 16.9 percentage points.
- For Hispanic students, the delinquency gap vis-à-vis White students is 9.3 percentage points and 12 percentage points respectively for AA and BA students.
What we see is that higher propensities to borrow, along with higher balances, tend to correlate with the likelihood of becoming delinquent. The notable exception to this is for all female students who are more likely to borrow and borrow more than males, but yet are less likely to be delinquent on their payments. 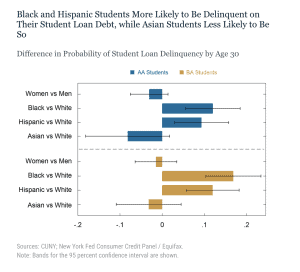
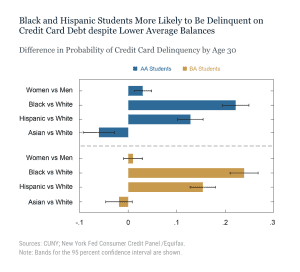
As we showed last week, women and all racial minorities tend to have lower credit card balances than white males at age 30. With regard to credit card delinquency, female AA and BA students were 3 percentage points and 1 percentage points, respectively, more likely to be delinquent than their male counterparts at each level of educational attainment. The gap for BA students is not statistically significant. As we saw with student debt above, the delinquency gap for credit card debt is also significant when we look at race. Specifically:
- Black students were significantly more likely to be delinquent on credit card debt than White students (22.2 percentage points and 23.9 percentage points, respectively, for AA and BA students.)
- The delinquency gap narrows with Hispanic students but is still wide. Hispanic AA students are 12.8 percentage points more likely to be delinquent than White AA students. The gap grows to 15.4 percentage points at the BA level.
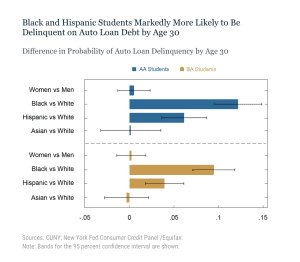
As we look at the auto loan chart below, we see that delinquency rates for women and Asians are not statistically different than men and Whites, respectively. Turning to racial differences:
- Black AA students were 12.2 percentage points more likely to be delinquent than their White AA counterparts. For those at the BA level, this delinquency gap moves to 9.5 percentage points.
- The delinquency gap between Hispanic and White AA students was 6.1 percentage points; at the BA level the gap drops to 3.9 percentage points.
 MORTGAGE DELINQUENCY RATES
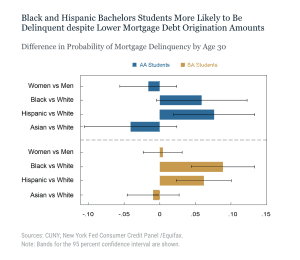
Finally, we look at mortgage delinquency rates. As we wrote last week, Black and Hispanic students at both the AA and BA level were less likely than White students to hold mortgage debt and, if they did, the origination levels were lower. But the story is flipped when we look at mortgage delinquency rates. Black and Hispanic students at both educational levels were considerably more likely to be mortgage-delinquent than their White counterparts.
- The Black-White mortgage delinquency gap was 6 percentage points for AA students and 9 percentage points for BA students, respectively.
- The Hispanic-White delinquency gap was 8 percentage points for AA students and 6 percentage points for BA students, respectively.
- Both women and Asian students were less likely to be delinquent on their mortgage payments than men and Whites, respectively.
SOURCE
To learn more about Recovery Decision Science’s Business Intelligence Team, contact:
Kacey Rask : Vice-President, Portfolio Servicing
[email protected] / 513.489.8877, ext. 261