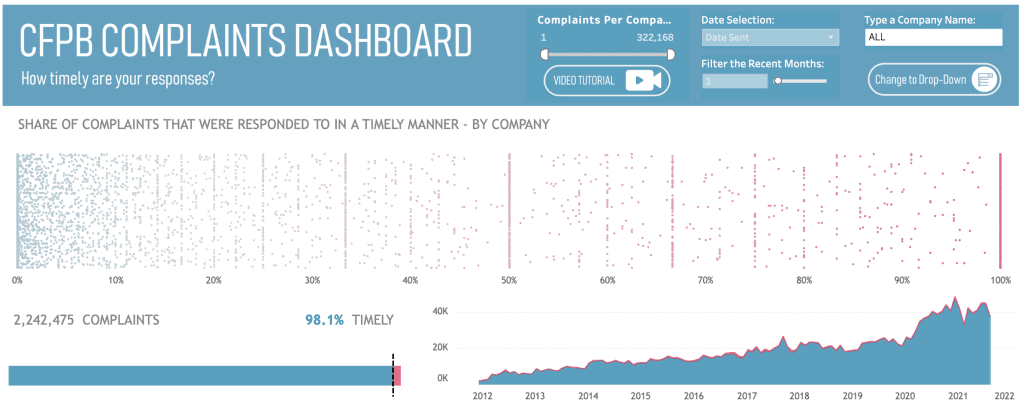
Recovery Decision Science has updated its CFPB Complaints Dashboard on its Public Tableau page.
The dashboard includes a company-by-company analysis of response times to complaints to the CFPB. Users can select a company from the pull-down menu. Then, using the dot-plot, you can compare that company to any of the more than 81,000 companies in the CFPB database in terms of timely response to complaints. As you work with the dot-plot, remember that blue is positive, meaning timely responses, and orange is negative.
Users can also do a deep dive on a company’s performance relative to a number of factors:
- Total number of complaints
- Complaints over time
- Percent of complaints that are responded to in a timely manner (i.e. within 30 days)
- Breakdown of product type (i.e. mortgage, debt collection)
- Source of complaint
- And if the consumer disputed the response
There were 37, 572 complaints filed in August, a surprising 16% drop from July’s 44,911. Since mid-2020, complaints have hovered in the range of 40,000 per month. For perspective, average monthly complaints in 2019 were 23,143.
For 2021, to date, 62.3% of all complaints filed to the CFPB are related to credit reporting. It’s worth noting that the number of credit reporting complaints DOUBLED between 2019 and 2020, fueled by as the economic downturn related to the pandemic. The second highest complaint category is debt collection at 14.2%

Of the 37,572 complaints filed with the CFPB in August, more than 98% were resolved in a timely manner.
To learn more about Recovery Decision Science, contact:
Kacey Rask : Vice-President, Portfolio Servicing
[email protected] / 513.489.8877, ext. 261
