We recently updated our CFPB Complaint Dashboard in Tableau Public. In this post, we’ll take a look at:
- Complaints 2019 vs. 2020
- The impact of COVID-19 on the complaint dashboard.
ABOUT THE DASHBOARD
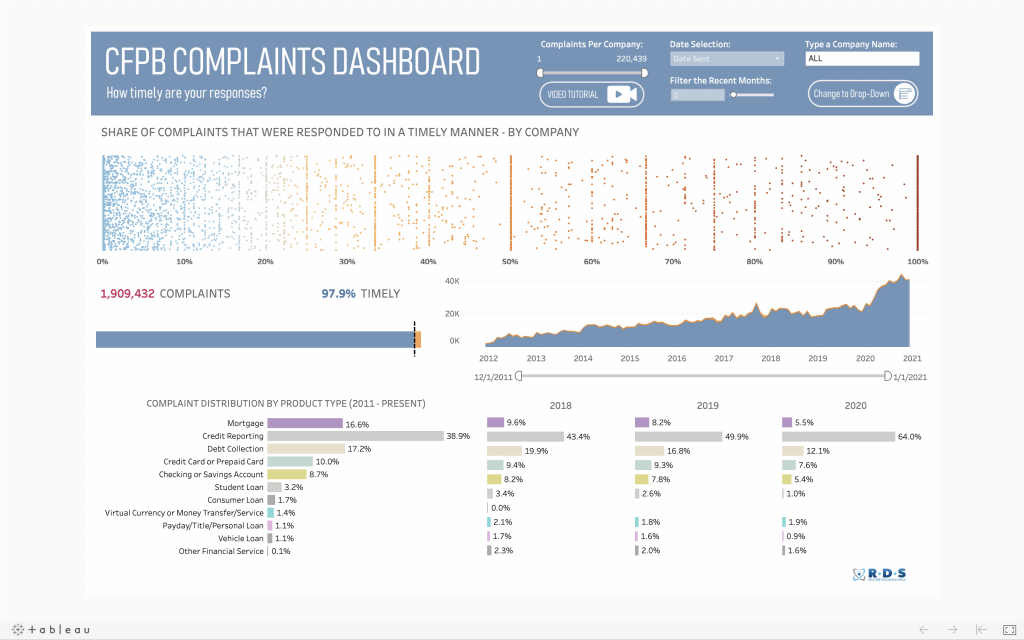
If you are unfamiliar with the dashboard, it includes a company-by-company analysis of response times to complaints to the CFPB. Users can select a company from the pull-down menu. Then, using the dot-plot, you can compare that company to any of the more than 81,000 companies in the CFPB database in terms of timely response to complaints. As you work with the dot-plot, remember that blue is positive, meaning timely responses, and orange is negative.
Users can also do a deep dive on a company’s performance relative to a number of factors:
- Total number of complaints
- Complaints over time
- Percent of complaints that are responded to in a timely manner (i.e. within 30 days)
- Breakdown of product type (i.e. mortgage, debt collection)
- Source of complaint
- And if the consumer disputed the response
Consumers have filed more than 1.9 million complaints since 2011. To date, nearly 98 percent have been addressed in a timely manner.
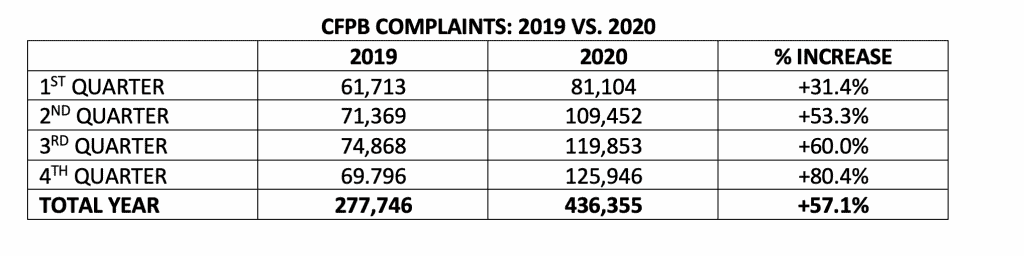
As you can see from the chart below, there were 57.1 percent more complaints to the CFPB in 2020, versus 2019. But what’s notable is that the trend grew dramatically by quarter, with complaints surpassing 125,000 in the 4th quarter, more than 80 percent more complaints than in Q4 2019.
THE IMPACT OF COVID-19
In July, the CFPB released a report on the impact COVID-19 had on complaints. The report covered the first five months of 2020, through May. Based on using coronavirus keywords, over 8,000 complaints during that period were related to the pandemic. This was about 5 percent of total complaints up to that point.
Of the complaints identified with coronavirus keywords, the CFPB reported:
- In 55 percent of mortgage-related complaints, consumers identified “struggling to pay the mortgage.”
- In 23 percent of credit card complaints, consumers identified a problem with the purchase shown or something on the statement as an issue.
- In 55 percent of credit reporting complaints, consumers identified incorrect information on their credit report as an issue.
Again, this report covered only the first five months of the year, during which time COVID-related complaints accounted for about 5 percent of total complaints. It’s fair to assume that COVID played an outsized role in the dramatic increase in consumer complaints through the balance of the year. We’ll continue to monitor the CFPB for updates.
SOURCES OF CFPB COMPLAINTS
The visual below breaks out the total complaints by type of complaint:
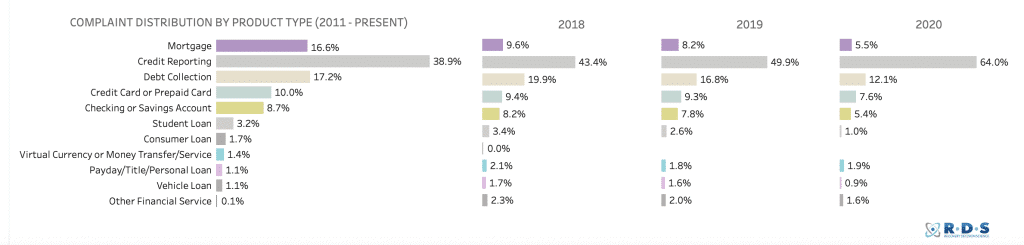
Note, there was a fairly substantial drop in mortgage-related complaints in 2020, likely reflective of the widespread mortgage forbearance included with the CARES Act. At the same time, as Americans relied heavily on credit to sustain them through the unprecedented level of job loss and furloughs, complaints about credit reporting soared by nearly 14 percentage points from 2019 to 2020.
Below is a screenshot of the interactive CFPB Complaint Dashboard found on the Recovery Decision Science Tableau Public page. This page is updated in real time, and can be accessed by clicking HERE.
Kacey Rask : Vice-President, Portfolio Servicing
[email protected] / 513.489.8877, ext. 261
SOURCE