NOTE: Because state unemployment data lags national by several weeks, this post covers both state and federal data for April only. As of this writing, national, national unemployment for May was released, showing a rate of 13.3 %, down from 14.7 % in April as discussed below.
Several weeks ago, we published our data visualization workbook covering the impact COVID-19 has had on American employment.
We’ve now updated the workbook to include the latest state-by-state data.
Here is a link to the workbook on the Recovery Decision Science Tableau page: ps://public.tableau.com/profile/recoverydecisionscience#!/vizhome/UnemploymentClaimsRates/1TableofContents
Here is an overview of the most notable changes from the initial workbook:
- In February 2020, unemployment rates were at an all-time low at 3.5%.
- In March 2020, the unemployment rate increased slightly to 4.4%, as initial unemployment claims started to roll in.
- In April 2020, overall unemployment rates hit their all-time high reaching 14.7%. According to the Bureau of Labor Statistics: “This is the highest rate and the largest over-the-month increase in the history of the series (seasonally adjusted data are available back to January 1948).”- https://www.bls.gov/news.release/pdf/empsit.pdf
- Nevada is the most impacted state, reporting an unemployment rate of 28.2%. This is over twice their previous low of 13.7%.
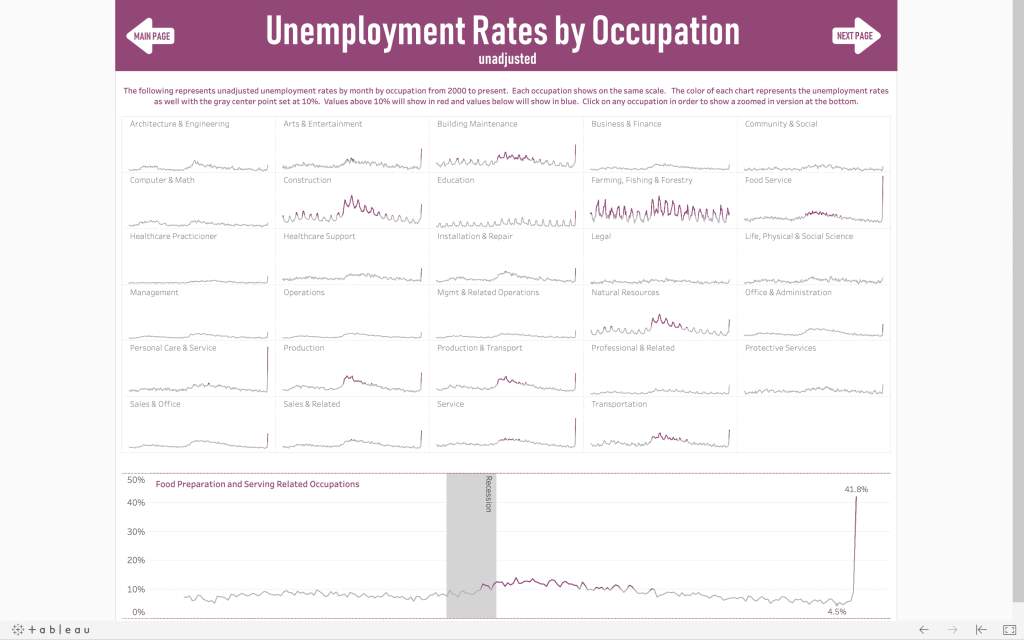
- The Food Preparation & Serving industry was the most impacted as it saw unemployment rates soar to 41.8%. This is closely followed by Personal Care and Service Occupations at 39.3%.
- Legal Operations and Computer / Mathematical Occupations, however, have not seen nearly the impact as they reported April rates of just 3.7% and 4.3% respectively.
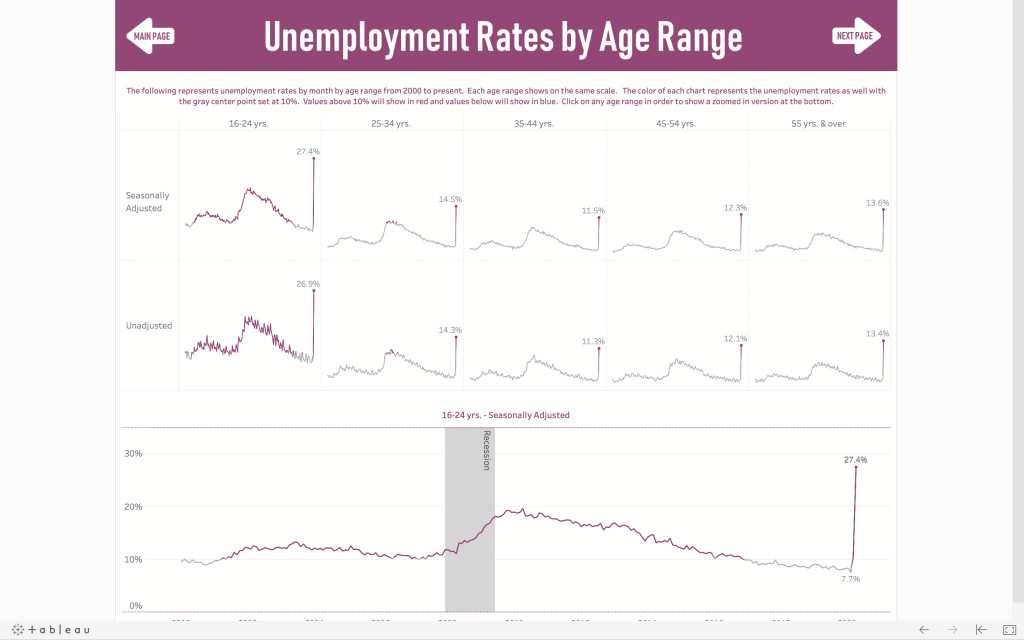
- Unemployment has had the greatest impact on the 16-24 age demographic. In April, 27.4% of 16-24 year olds made initial unemployment claims, nearly a 3X increase from 10.0% in March.
- On a somewhat positive note, initial claims decreased 13% from March to April.
We will continue to track changes to the unemployment story and update our workbook accordingly.
Again, here is a link to RDS’s complete, data viz workbook. ps://public.tableau.com/profile/recoverydecisionscience#!/vizhome/UnemploymentClaimsRates/1TableofContents