Since the earliest days of the pandemic, the RDS Business Intelligence team has used its Tableau Public page and this blog to report on the upheaval created by the economic shutdown.
One of our primary focus areas has been the housing market, as housing expenses represent the largest portion of the average household’s budget… and related debt obligations. Our Tableau interactive workbook updates the following reports monthly:
- 30 YEAR FIXED MORTGAGE RATE TRENDS
- MORTGAGE APPLICATIONS: NEW AND REFINANCE
- SEASONALLY ADJUSTED MONTHLY HOME SALES
We’ve also written extensively about how the pandemic exacerbated economic inequality and the policy steps taken to ameliorate some of this inequality.
In today’s post we revisit the housing market, but with a particular focus on the possible impact renters face now that most government support mechanisms are no longer in place.
OVERVIEW: HOMEOWNERS & RENTERS
According to a study published by iPropertyManagement.com:
- 44 million households (36% of total households) rent rather than own.
- 65% of renters are young adults, 35 years old or younger.
- Median age of homeowners is 47, compared to 36 for renters.
- 72% of renters report a desire to own their own home; only 45% of this group is able to afford making a purchase.
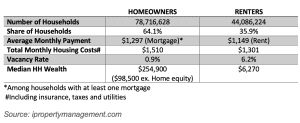
The following chart from the same study breaks out the differences between renters and homeowners. Perhaps, most notably, we see the role that wealth plays in the ability to own vs. rent. Subtracting home equity, homeowners today have nearly 16 times more wealth than the average renter.
THE PANDEMIC AND RENTERS
The pandemic hit renters particularly hard.
Consider that many renters live in close proximity to their jobs, as they cannot afford to own their own vehicles. The types of jobs renters hold were hit the hardest by the Covid shutdowns: restaurants, bars, personal services, retail. These are also jobs that did not lend themselves to remote working.
The government responded in two ways that helped renters in the short term:
- Enhanced unemployment compensation and stimulus checks helped renters stay current on their lease payments.
- Federal, state and local governments put holds on evictions, thus keeping the overall eviction rate as pre-pandemic levels.
In the early stages of the pandemic, rent increases slowed. However, they began to climb by mid-2021, fueled by increased demands (more renters were looking for their own place), and supply chain shortages. As a result, rents in August, 2022 were up 7% versus a year ago, and more than 10% versus pre-pandemic levels.
EVICTION EXPERIENCE & EXPECTATIONS
As part of its annual consumer housing survey, the New York Federal Reserve asked renters to report on their experience with eviction: either through their own eviction experience or the experience of someone with whom they are personally acquainted.
For the 2022 survey, the Fed, for the first time ever, asked current renters about their expectations of a future likelihood of eviction: “What is the chance that you will be evicted in the coming year?”
Here’s what the Fed learned from the survey:
- About 70% of renters believe there is a zero-chance of being evicted by February, 2023.
- 20% report a chance of between 1-10% of being evicted.
- The remaining 10% report their chance of being evicted as more than 10%.
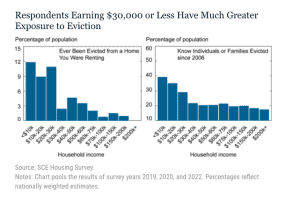
Not surprisingly, with regard to their experience with eviction (whether personal or people they know), most eviction activity is concentrated among those households in the lowest income bracket. Although, it’s interesting to note that the spread is somewhat flatter across income groups when it comes to knowing persons or families who have been evicted.
INCREASING RENTS AND EVICTION EXPECTATIONS
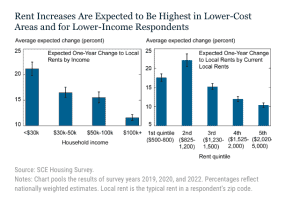
Overall, owners and renters expect rents to increase by as much as 15% during the coming year.
As we see from the chart below, those in lowest income brackets, who also tend to pay the lowest rents, expect the largest year over year increases.
Given the expectations for fairly substantial rent increases, it would be natural to assume that renters would have equally strong expectations about the potential for evictions. This is especially true given that incomes are not likely to keep pace with rent inflations.
While increased housing costs do, in fact, correlate statistically with increased expectations for evictions, the relationship is more directional than anything. Specifically:
“A respondent expecting a 20% rent increase in their zip code over the next year perceives only about a one percentage point higher risk of eviction compared to someone expecting no rent increases.”
As it turns out, however, the most important factor in driving consumer expectations of higher eviction rates is a person’s previous experience with evictions.
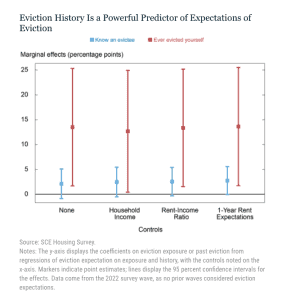
The chart below shows the effects of past eviction experience (for oneself or an acquaintance) on the expectation of eviction in the coming year. Here’s what we learn:
- Respondents who knew someone who was evicted since 2006 perceive their own chance of being evicted as being 2.5 percentage points higher than other respondents.
- More dramatically, respondents who have experienced eviction themselves predict their chance of eviction during the coming year as 13 percentage points higher than other respondents.
The Fed’s report concludes:
“These results are consistent with previous research indicating that evictions frequently become a spiral for households, as well as the notion that previous experiences make eviction risk more salient for renters.”
In addition to our extensive reporting on the U.S. housing market in Tableau, we recently published an interactive dashboard charting rental costs on a county by county basis. CHECK OUT THE DASHBOARD HERE.
SOURCE
To learn more about Recovery Decision Science Business Intelligence team contact:
Kacey Rask : Vice-President, Portfolio Servicing
[email protected]/513.489.8877, ext. 261