In this post we continue our on-going coverage of the pandemic’s impact on the U.S. economy, especially as relates to the housing market.
Using a recently-published, two-part study by the Federal Reserve Bank of New York, we’ll look at housing from two angles over the coming weeks:
- Do rising home prices presage another housing bubble?
- Will we experience an increase in mortgage foreclosures if prices begin to fall?
For the purpose of these analyses, the Fed is using the 3 year period (2003 through 2005) leading up to the Great Recession as the benchmark for comparison. In other words, are the current market dynamics and trends similar to what we experienced in the early 2000s and, if so, should we be alarmed by the potential consequences.
HOUSING PRICES AND THE PANDEMIC
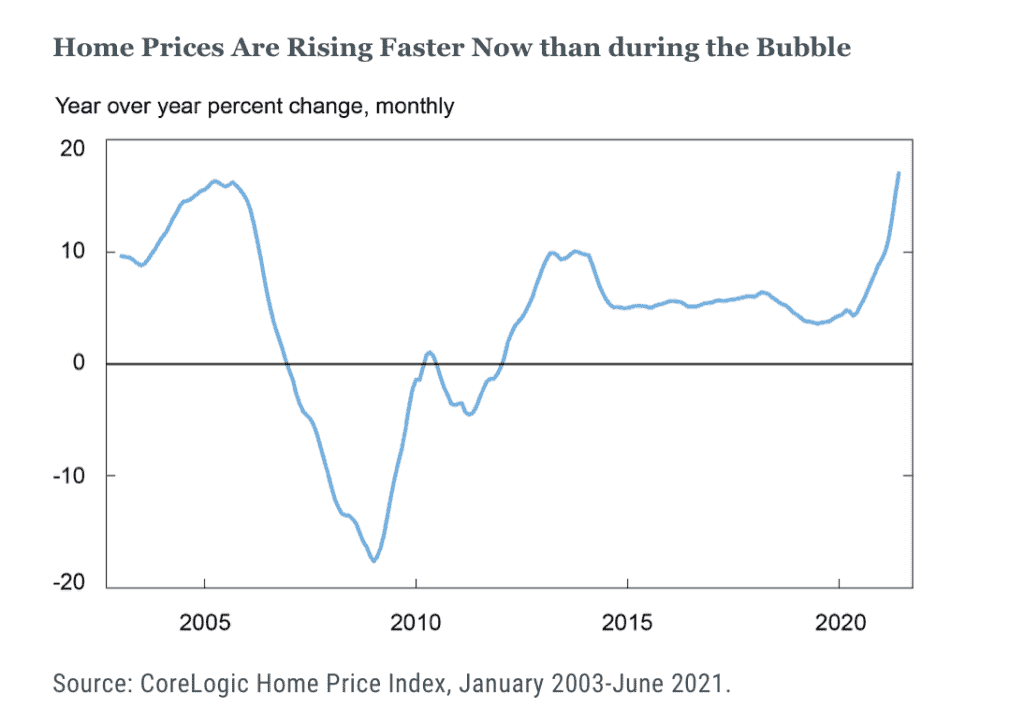
Despite record levels of unemployment in the early months of the COVID-19 shut-down, U.S. home prices, after experiencing a minimal drop, regained their momentum and continued to rise throughout 2020 and into 2021.
In fact, as we see in the chart below, the current rate of growth in home prices is actually faster than it was in the early 200s. This might be cause for alarm. However, as the authors note, there is a fairly dramatic different between the two periods. Specifically, prior to the Great Recession, we had three consecutive years of double-digit (14 percent) increases in home prices. At present, we’ve only had one year of double-digit price increases.
REGIONAL DIFFERENCES
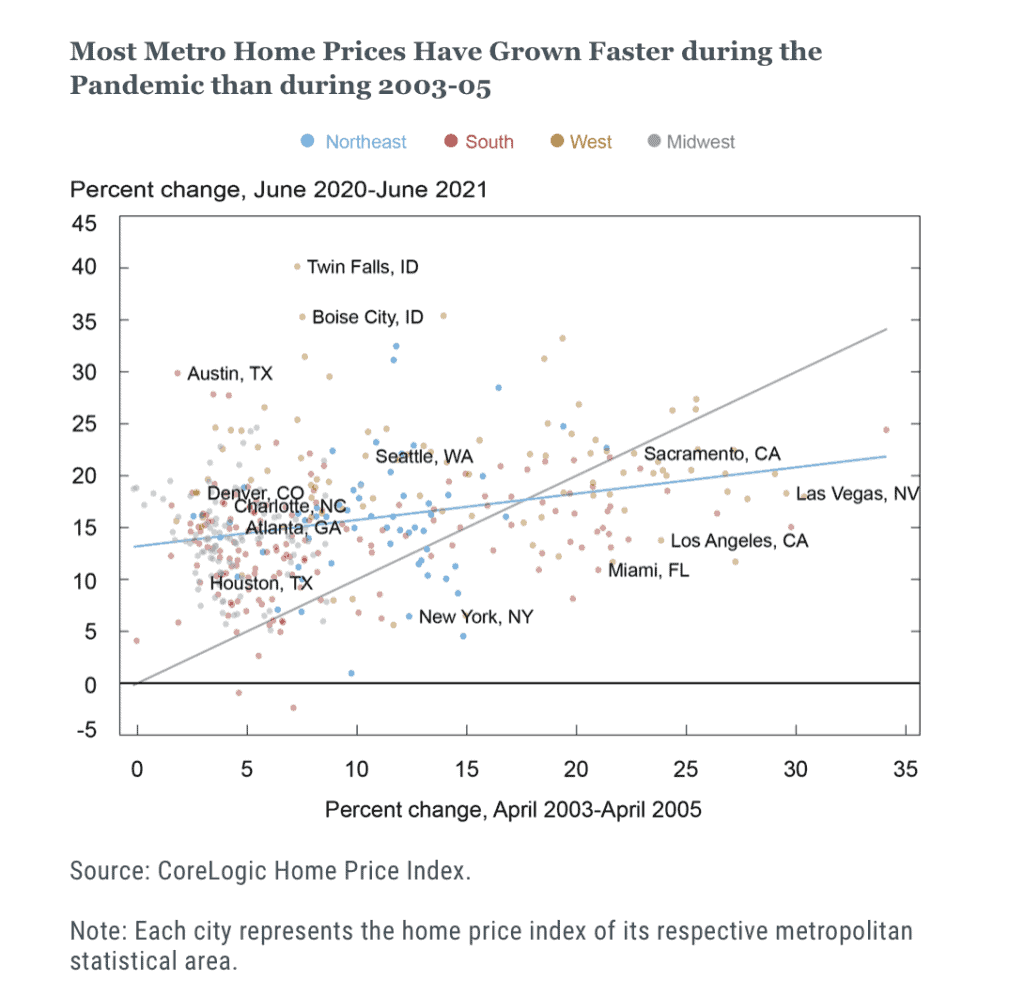
Compared to the housing bubble of the early 2000s, the current housing boom is happening in many different places, both within and across metro areas. The Fed’s data suggests that 79 percent of metro areas experienced higher home price increases during the pandemic than during early 2000s boom. Looking even deeper, of the 30 most populous metro areas, 63 percent saw faster growth during the pandemic compared to 2003-05.
In the chart below, you’ll see a solid, 45 degree line. This line divides housing growth rates for metro areas during the pandemic (above) and 2003-05 (below). A few notable points:
- During the pandemic, cities like Austin, Charlotte, Seattle and Austin experienced higher home price growth.
- By contrast, during the pre-Recession period, Las Vegas, Los Angeles and New York were three of the big cities with higher price increases.
- There were certain metro areas, such as Sacramento, with similar rates of price increases between the two periods.
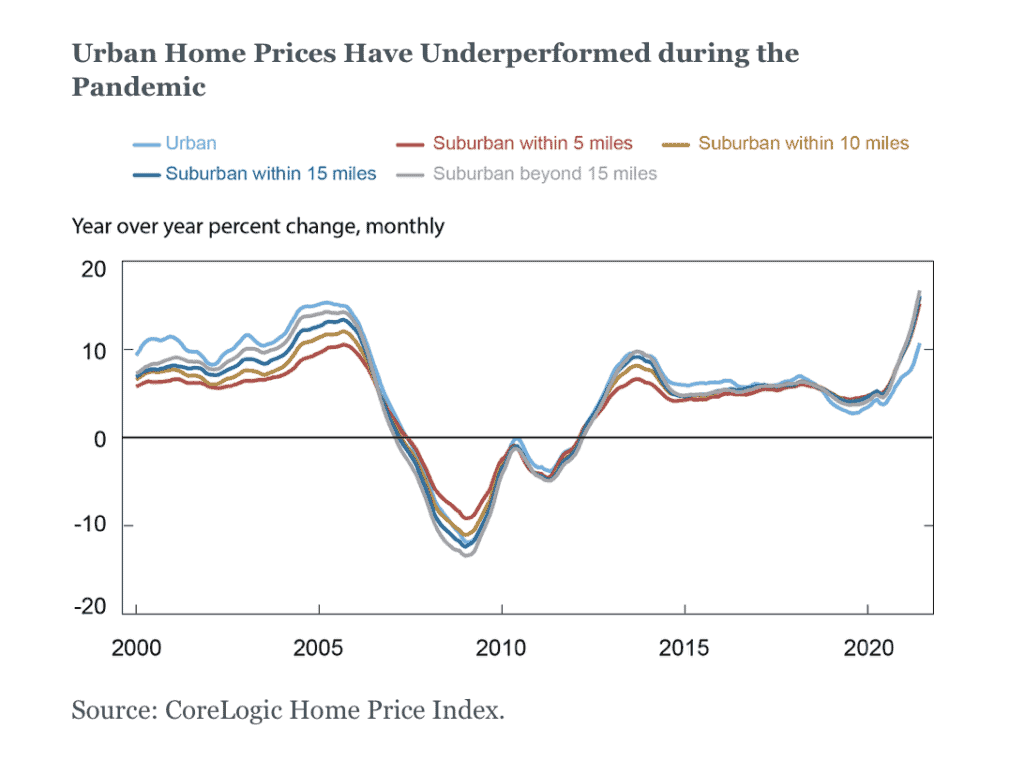
The chart below looks at home price trends from both an urban and suburban perspective. Here is how the Fed categorized each:
- Urban is defined as being within five miles of an “employment hub” (zip codes with the highest employment density), belonging to a metropolitan statistical area and having a population density greater than the 95th percentile.
- There are four suburban classifications: “if they are within 5, 10, 15, or 15+ miles of the employment hub and if they are not already classified as urban (or any other suburban category).”
In looking at the chart, we see:
- In general, urban areas have had higher, year-over-year home price growth compared to suburban areas.
- However, in late 2018, urban price growth slowed relative to suburban rates.
- Urban housing prices begin to rise during the early months of the pandemic, but at a slower rate that all suburban classifications.
The Fed also notes, as we see in the chart below, that there are fairly significant regional differences with urban areas. Notably:
- With the exception of the Midwest, year-over-year price increases in the five years leading up the pandemic followed similar trends across the regions.
- While all regions experienced increasing home prices during the pandemic, the Northeast began to experience stagnation as we moved into 2021.

This study shows that the current boom with regard to housing prices is not the same as the prolonged boom that preceded the Great Recession. At some point soon, most economists expect home prices to normalize. The question remains: what will this normalization mean for many homeowners?
SOURCE
To learn more about Recovery Decision Science’s Business Intelligence Team, contact:
Kacey Rask : Vice-President, Portfolio Servicing
[email protected] / 513.489.8877, ext. 261