Over the past few years, the RDS Business Intelligence team has been looking closely at various aspects of the U.S. housing market through its Public Tableau page, including:
- 30-year fixed mortgage rate trends
- Seasonally-adjusted home sales by month
- New purchase mortgage applications
- Refinance applications
To learn more, check out our RECENT POST on the housing market. As a new extension of our housing series, the BI team recently launched an interactive data viz workbook. In this workbook, we look at rental costs on a county-by-county basis for every U.S. county We recently expanded on our look at housing by adding an interactive viz on the cost of renting in the U.S. Specifically, we developed an analysis of median rents for every county in the U.S. 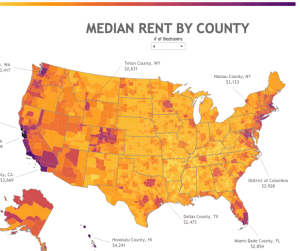
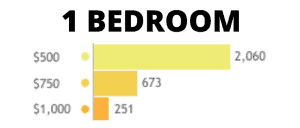
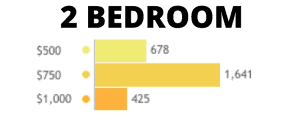
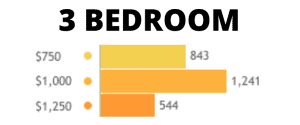
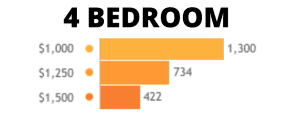 Here is a LINK to our rental viz on Tableau Public. Choose the number of rooms in the drop-down menu at the top of the viz, then hover over the counties you’re most interested in to see the median rent you’d have to pay. Or, you can click on the Show as Table button on the top right to find your county, and related rent per number of bedrooms.
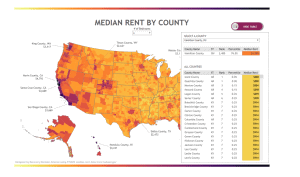
- The total size of the U.S. rental industry is $169.5 billion. (Source: Ibisworld).
- Over the past five years, the rental market has been relatively flat, with only 0.2% growth. (Source: Ibisworld).
- 3 million households are renting. This is up from 34.6 million in the leadup to the Great Recession. Renting households now make up 36.6% of all housing. (Source: Pew).
- Renting households spend $485 billion per year on their housing costs. Interestingly, New York and Los Angeles alone comprise more than 8% of this total, with New Yorkers alone spending more than $50 billion per year to rent. (Source: Fortune/Zillow).
- The current rental vacancy rate is 7%, which is the lowest it’s been since the mid-80s. it’s interesting to note that the occupancy rate leading to the Great Recession was extremely low as people across all demographic groups flocked to the housing market. Of course, after the housing crash, we saw a significant increase in rental occupancy. (Source: Federal Reserve).
- Nearly 2/3 of U.S. adults 35 and under are renters. For reference, this is up from 57% for the same demographic in the period from 2000-2009. (Source: Pew).
We’ll continue to look at the U.S. rental market in the months ahead. SOURCE https://policyadvice.net/insurance/insights/rental-statistics/ https://www.statista.com/topics/4465/rental-market-in-the-us/#dossierKeyfigures
To learn more about the RDS Business Intelligence Team contact:
Kacey Rask : Vice-President, Portfolio Servicing
[email protected] / 513.489.8877, ext. 261