On March 16th, the National Community Reinvestment Corporation (NCRC) conducted a live webinar to unveil its new Fair Lending Report interactive Tableau dashboards. The dashboards were developed by the NCRC, with the support of Unifund/Recovery Decision Science through the Tableau Foundation.
Today we publish the first in a two-part series covering development of the dashboards.
ABOUT NCRC
Formed in 1990, NCRC brings together national, regional and local organizations to increase the flow of private capital into traditionally underserved communities. Comprised today of over 600 community-based organizations, NCRC promotes access to banking services, affordable housing, entrepreneurship and job creation.
Some of the focus areas for NCRC members include:
- Renovating and building affordable housing for low-and-moderate income (LMI) families.
- Providing counseling to home buyers and owners, as well as business-building expertise to entrepreneurs.
- Training and supporting housing counselors.
- Testing, monitoring and challenging discrimination in financial services and housing.
- Facilitating dialog between financial institutions and community networks to increase lending, investments and philanthropy in underserved areas.
NCRC identifies a number of key accomplishments in their most recent annual report, including:
- Facilitating agreements with banks that committed more than $67 billion for lending investments and philanthropy in local communities.
- Providing training to nearly 6,000 members on fair housing laws, fair lending and the Community Reinvestment Act.
- Producing groundbreaking and widely cited research that found gentrification is rare, as most communities suffer from a lack of investment.
- Renovating and selling 251 homes, 81 percent of which supported home ownership for LMI families.
ENTER THE RDS TABLEAU ZEN MASTERS
One of NCRC’s most important membership tools is its Fair Lending Report, a suite of interactive dashboards that detail national and community-based practices as it relates to topics such as mortgages and business lending.
NCRC recently embarked on a project with the Tableau Foundation to modernize and expand those interactive workbooks. The Unifund/Recovery Decision Science (RDS) Analytics and Business Intelligence team, in turn, volunteered its time to NCRC and the Foundation to guide the process.
Ranked as the second most “favorited” company on Tableau Public, RDS (the data analytics affiliate of Unifund), has also helped to revolutionize the debt recovery and collections industry through its use of AI, machine learning and data visualization dashboards. Three of RDS’s most notable innovations fall within the Paymetrix suite of analytical tools, and are summarized in these recent blog posts:
- Paymetrix AD: A Game-Changing Account-Decisioning Tool for the Collections Industry
- Paymetrix AI: The Power of Asset Identification
- Paymetrix RE: Finding the Gems in a Portfolio
The NCRC/Tableau Foundation project at RDS was anchored by Kevin Flerlage, Tableau Zen Master, with support from fellow RDS Tableau Zen Master, Jeffrey Shaffer. For those unfamiliar, Tableau Zen Masters share three distinct qualities:
- Master of Tableau Software, with the ability to develop innovative ways to use Tableau.
- Passion to serve as Tableau evangelists, and, in particular, a willingness to teach others how to be better Tableau users.
- Collaborative spirit that fosters sharing tips and tricks that Tableau developers themselves haven’t considered.
It’s worth noting that only 90 people in the world hold, or have held, the title of Tableau Zen Master. As of 2021, there are only 43 Zen Masters worldwide with an additional 12 in the Zen Master Hall of Fame (one of which is our very own, Jeffrey Shaffer).
In our next post in this series, we will talk with Kevin Flerlage about the NCRC project and what it takes to become a Tableau Zen Master.
THE NCRC DASHBOARDS
Working closely with NCRC, the RDS Analytics team developed a suite of 18 interactive dashboards for the Fair Lending Report.
The dashboards will be available for the public to review until April 15 after which they are only available to members. If you’d like to review the dashboards, CLICK HERE.
In addition to several broad demographic reports, the suite of Fair Lending dashboards is broken into three essential groups:
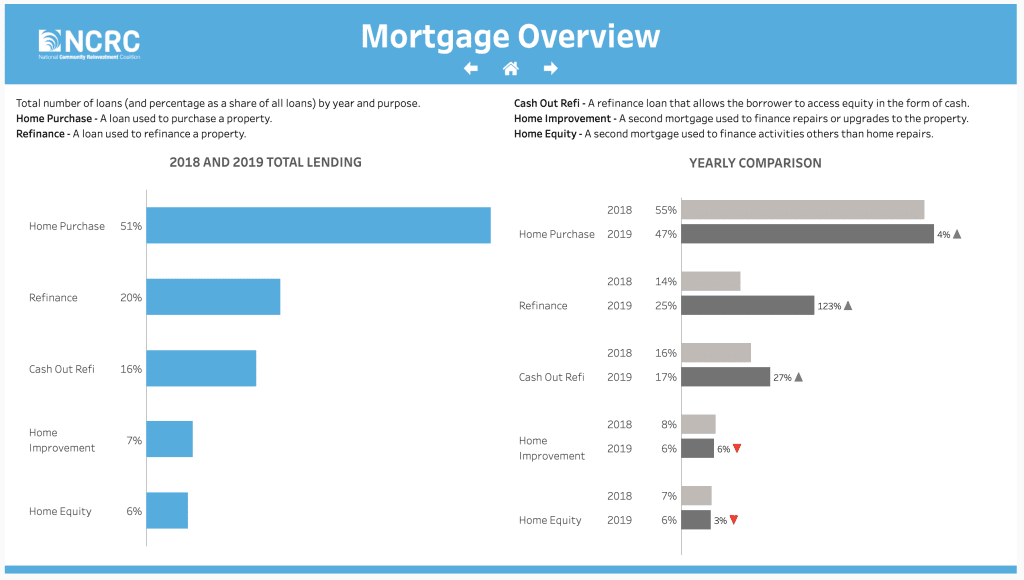
- Personal mortgage reporting, including:
- County-level mapping of secured mortgages based on race and income
- Mortgage lenders and originators
- Loan interest rates and related fees
- Government lending by race
- Denial rates and reasons
- Top lenders by volume
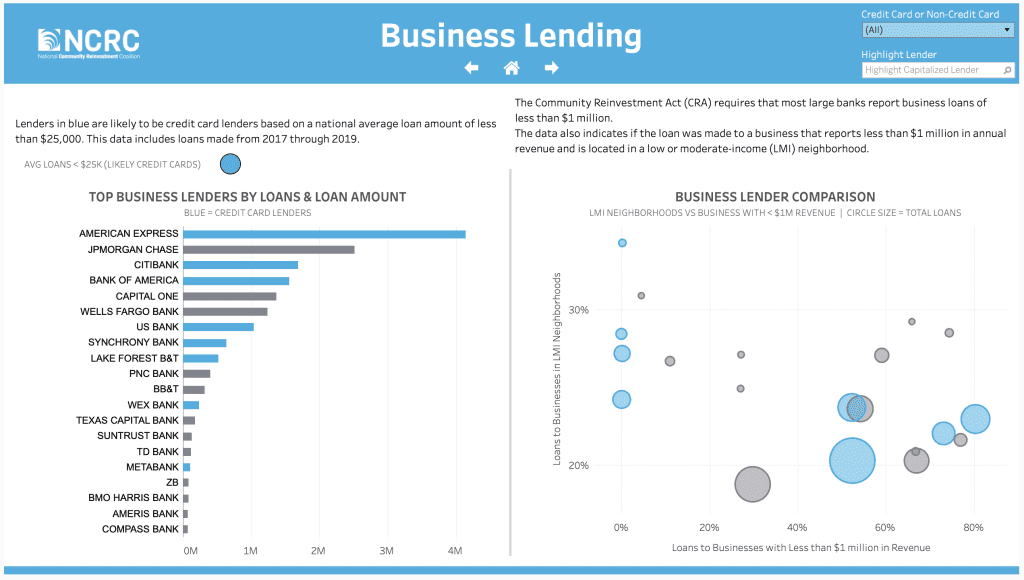
- Business lending, including:
- Business lending concentrated in LMI neighborhoods to businesses with less than $1 million in revenue
- Business lending by neighborhood income
- Business lending by race
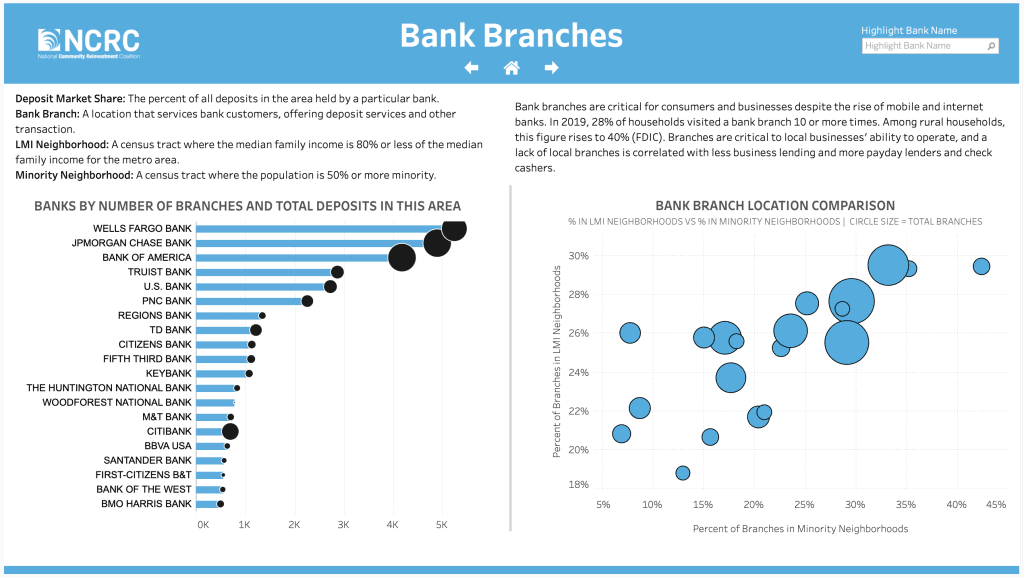
- Bank branch allocations, including:
- Concentration of bank branches in LMI and Majority Minority neighborhoods
- Bank branches by neighborhood income
- Bank branches by neighborhood race
Again, to view the entire suite of Fair Lending Project dashboards while they available to the public through April 15, CLICK HERE.
To learn more about Recovery Decision Science contact:
Kacey Rask : Vice-President, Portfolio Servicing
[email protected] / 513.489.8877, ext. 261