Fueled by another period of historic-low mortgage rates, home sales continue to grow, albeit, not as fast as refinancing activity.
The RDS data analytics team recently updated its Econometrix Tableau real estate workbooks.
Here’s a summary of our real estate-related visualizations, along with links to the related, interactive Tableau workbooks:
MORTGAGE RATES
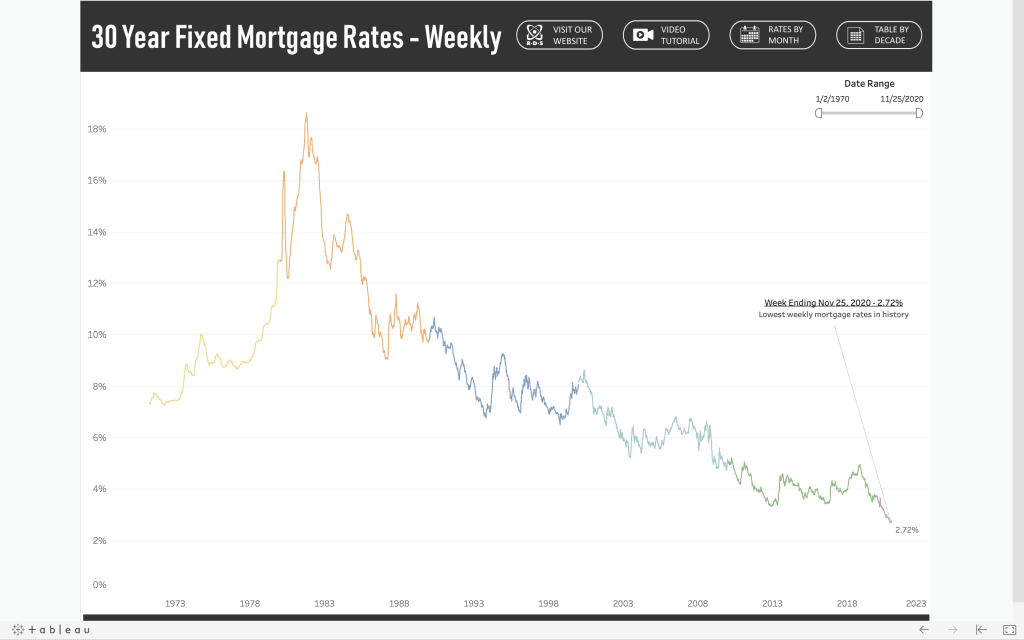
As of November 25th, the 30-year fixed mortgage rate was 2.72%. The current rate is 26% lower than the (still very low) rate of 3.66% for the same week a year ago.
To put the current rate of 2.72% in historical perspective, the average rate in the decade of the 2010s is 4.09, and 7.91% over the 50 year span covered in our workbook.
Below is a snapshot of the mortgage rate viz dating back to the early 70s.
CLICK HERE to see the Mortgage Rate interactive viz on the RDS Public Tableau page
MORTGAGE APPLICATIONS
The Mortgage Bankers Association (MBA) reports weekly on two types of mortgage applications:
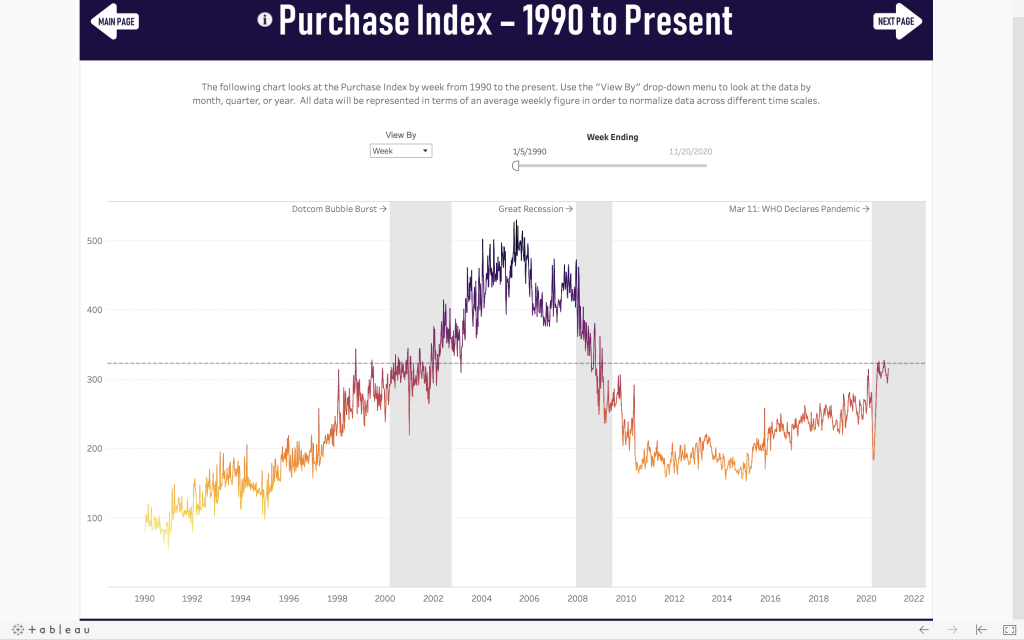
- MBA Purchase Index: The Purchase Index is a leading indicator of home sales by 4-6 weeks, meaning that it is a predictor of housing activity. Housing economists and home builders use the index to forecast new and existing home sales.
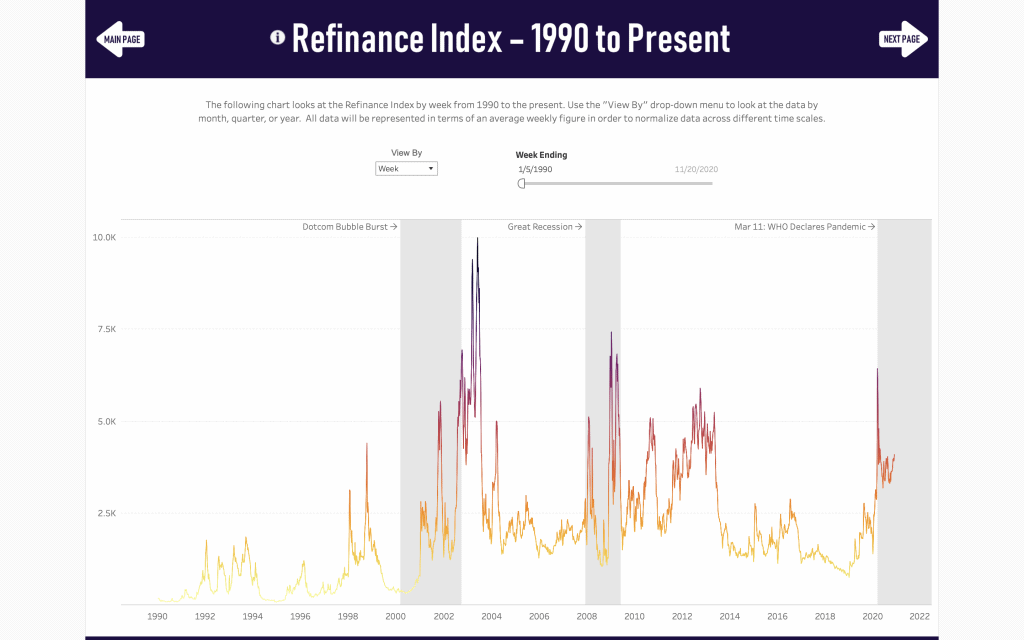
- MBA Refinance Index: The Refinance Index is a tool to predict mortgage activity. Homebuilders pay attention to the Refinance Index because it is a leading indicator of home sales. On the other hand, mortgage investors also take notice of the index as it is a leading indicator of mortgage pre-payment activity.
MBA Purchas Index
The year started strong, with the Purchase Index climbing past 300 (313.7) for the first time since October, 2009.
But as the reality of the pandemic started to take hold, the real estate market started to freeze up, and the Purchase Index plummeted 41%, hitting a 5-year low of 186.4 on April 17th. But, as the Fed continued to push interest rates lower, the market responded. In three months, the Purchase Index climbed 75% to hit an 11-year high of 325, on July 3. As of November 20, the Purchase Index is still strong, at 315.
CLICK HERE to see the Purchase Index interactive viz on the RDS Public Tableau page
MBA Refinance Index
Also, as a response to record-low interest rates, the refinance market has had a wild ride in the first seven months of 2020.
Refinance activity has been on an upward swing since the Refinance Index hit an 18-year low in 2018. The Index grew 71% in 2019 and is on pace to grow another 108% through 2020. But as you can see from the screenshot below, the Index has been on a wild ride since the first of the year, hitting an 11-year high of 6,419 on March 6th (a 479% increase versus the same date a year ago). The Index currently stands at 4,078, up 178% versus YAG.
CLICK HERE to see the Refinance Index interactive viz on the RDS Public Tableau page
HOME SALES
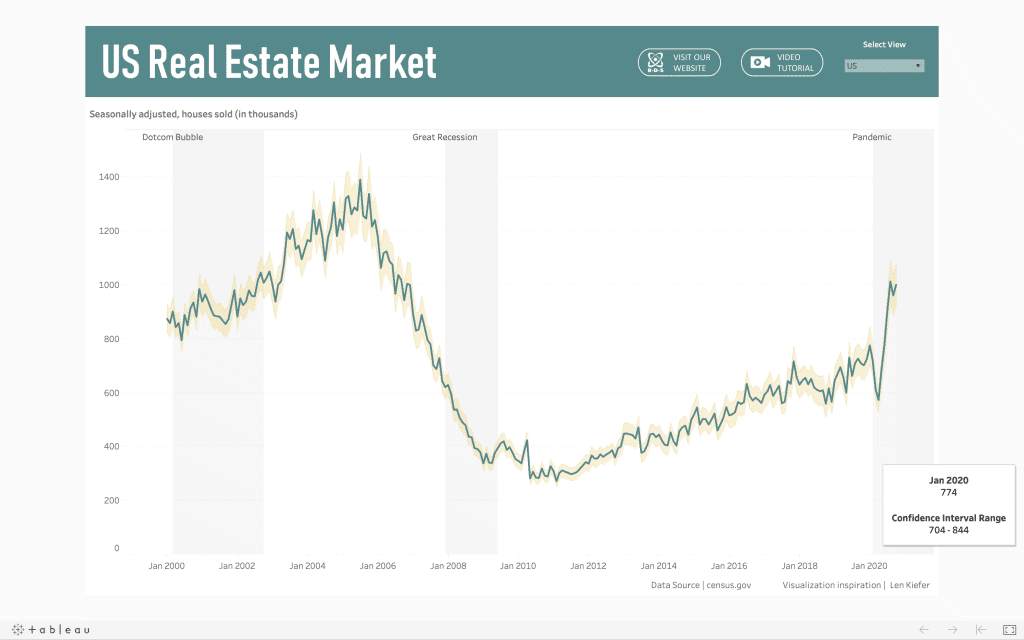
As mortgage rates continue to push to new lows, home sales are responding in kind. For our most recent full-month, October, the adjusted number of homes sold for the month was 999,000, a 41% improvement over October, 2019’s adjusted level of 707,000.
CLICK HERE to see the Home Sales Interactive Viz