Over the past few years, we have been blogging about Recovery Decision Science’s expanding body of Tableau data visualizations covering various aspects of the American economy.
These visualizations and related posts have taken on greater urgency as COVID-19 essentially shut down the economy beginning in mid-March. But the economy is beginning to stir as Americans emerge from months of shelter-in-place restrictions. Still, in the absence of a COVID-19 vaccine, many health experts caution that we will continue to live under the cloud of COVID-19, especially as we move into the cooler autumn months.
Anticipating an indefinite period of economic uncertainty, our data analytics team has consolidated our most relevant and timely interactive visualizations under one umbrella called Econometrics.
While we expect the Econometrics portfolio to expand in coming month and years, today it includes the following analyses and related visualizations:
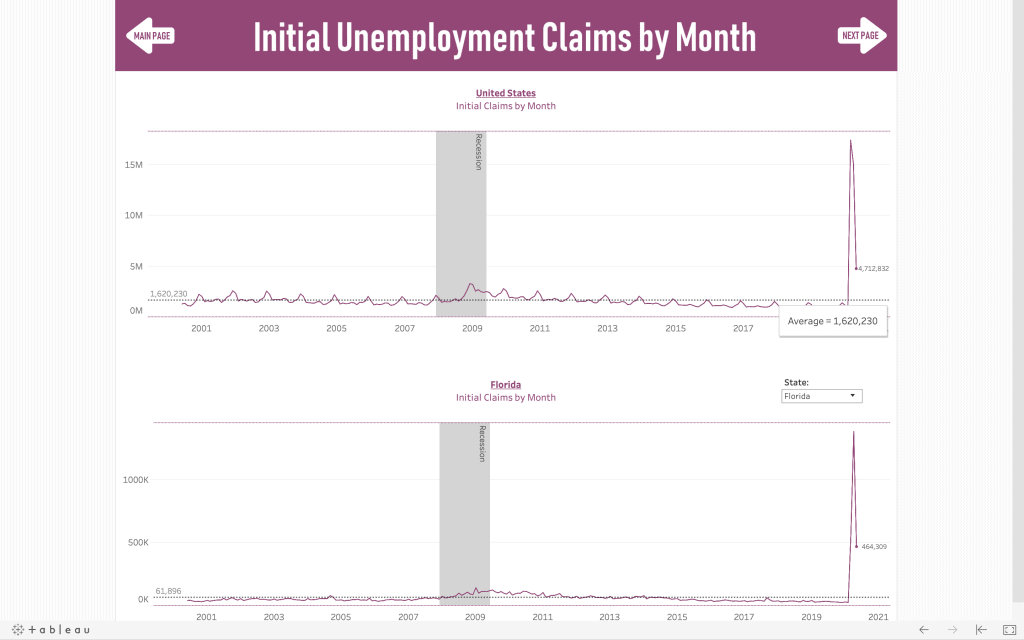
- UNEMPLOYMENT WORKBOOK: We look at unemployment from myriad angles: national vs. local, county-level, and rates by: age, occupation, industry, race/ethnicity, gender and education level.
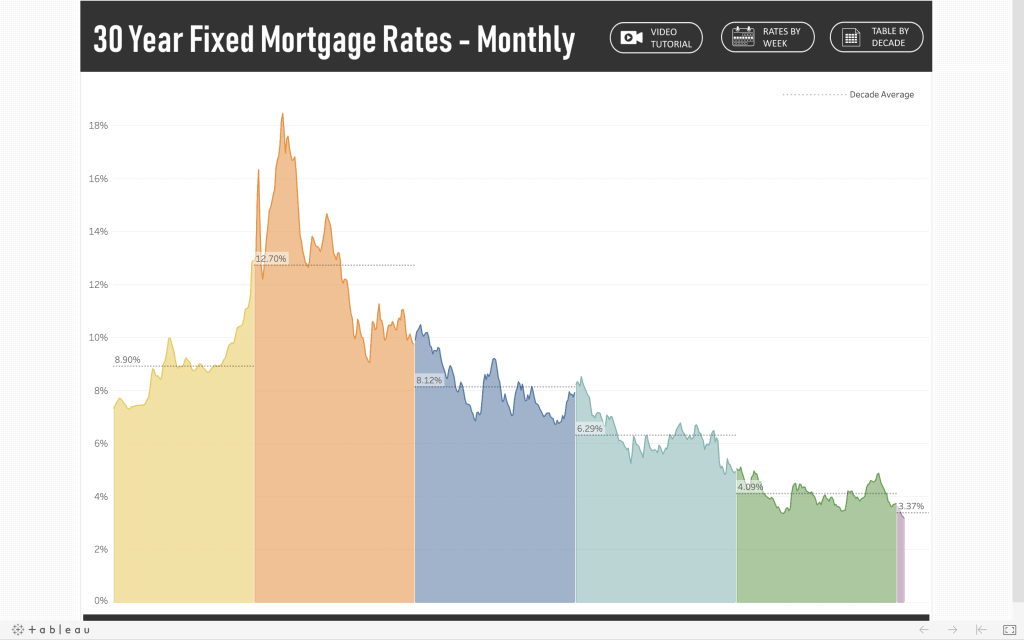
- MORTGAGE RATES: We look at 30-year fixed mortgage rates going back to 1970, on both a monthly and weekly basis. As of June 18, the 30-year fixed rated hit 3.13%, it’s lowest level in the past 50 years
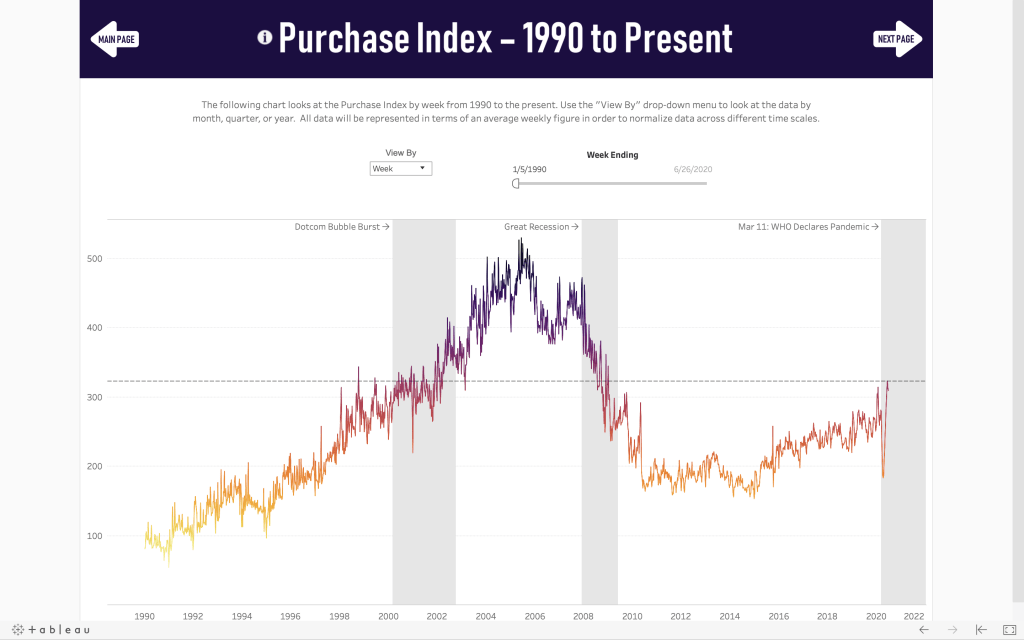
- MORTGAGE APPLICATIONS: We look at mortgage applications, both for new home purchases as well a refinancing loans. After a precipitous drop from March through May, mortgage applications spiked the past several weeks.
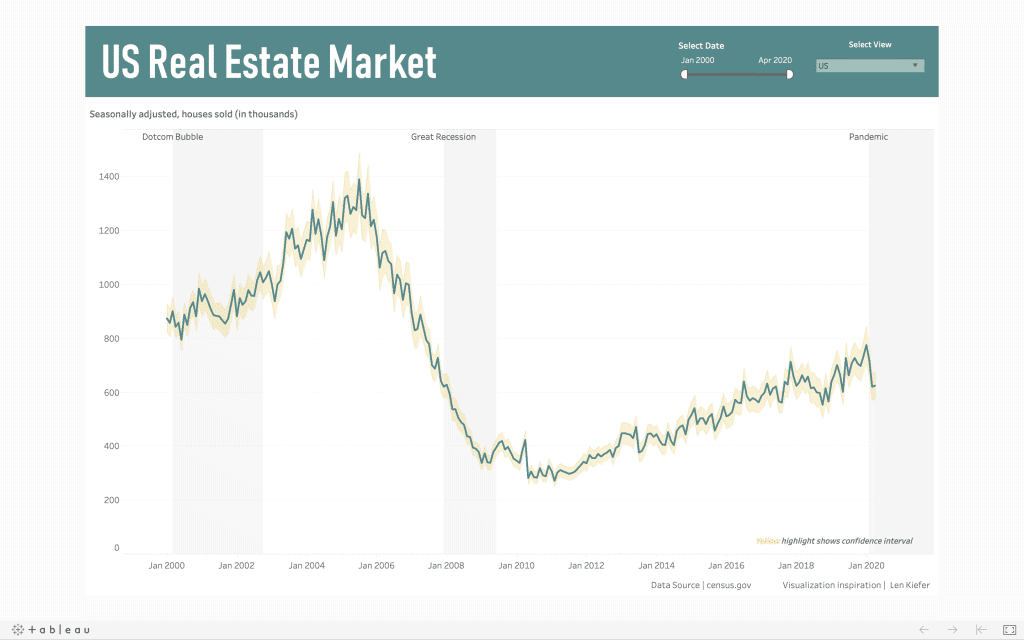
- HOME SALES: We look at seasonally-adjusted home sales on a month-to-month basis going back to 2000. Between January and the end of March, home sales dropped 20%. But we saw an uptick in April and, based on the aforementioned spike in mortgage applications, it’s fair to assume that housing sales should continue to grow moving into the summer months.
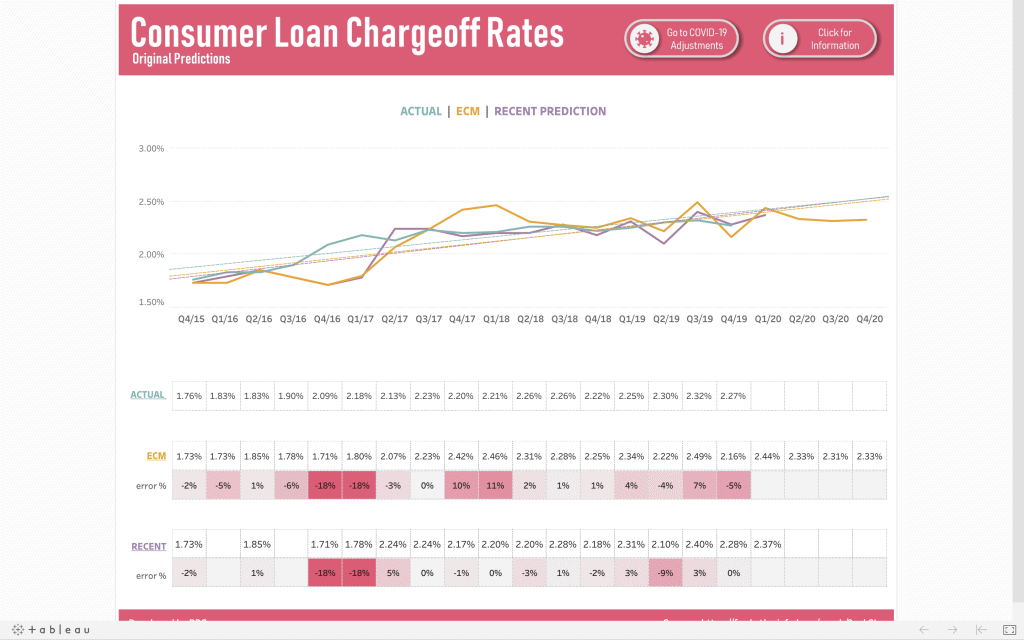
- CONSUMER LOAN CHARGE-OFF RATES: RDS has been predicting charge-off rates for more than four years. As a result of the economic crisis, we can expect to see an increase in charge-off levels in subsequent quarters.
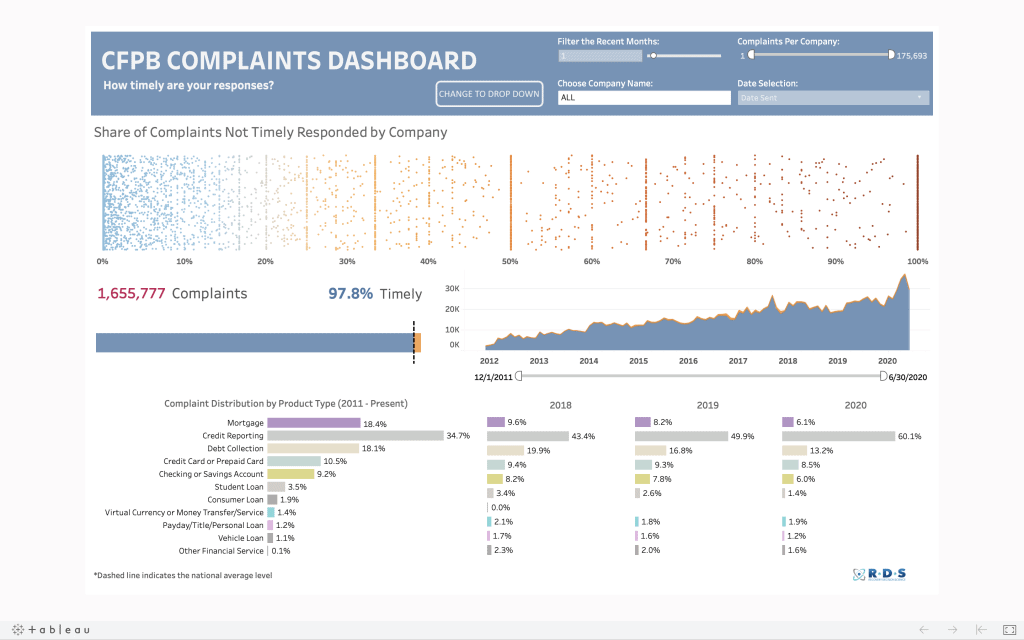
- CFPB COMPLAINT DASHBOARD: We’ve been tracking complaints made to the CFPB since the report was first published in 2011:
CLICK HERE to review all of the visualizations in our Econometrix workbook.
You will also find a brief video introducing you to each section of Econometrix.
Error: Contact form not found.


