It’s estimated that more than two million Americans face the risk of eviction in a typical year.
But 2020 is far from a typical year, as we enter the 6th month of a pandemic that has had a devastating impact on all aspects of our economic and cultural lives. In the early phase of the pandemic, Congress authorized enhanced income support for those who lost their jobs. In addition, governments at all levels instituted eviction moratoriums to keep renters in their homes. The moratoriums covered an estimate 12 million Americans, or 30% of all renters.
As both the enhanced support and eviction moratoriums come to an end in some fashion, there are fears of an unprecedented wave of evictions. Estimates range from 23 million to as many as 43 million people who could lose their homes without another round of emergency support.
To address the impact COVID-19 is having on the economy, the New York Fed is running a five-part series on Heterogeneity in America. In last week’s post, we covered Inequality in U.S. Home Ownership rates by Race and Ethnicity. Today, we’ll cover the story of Who Has Been Evicted, And Why?
METHODOLOGY
The Fed conducted an extensive survey, covering three distinct areas/questions:
- First, they asked respondents whether they know someone who’s been evicted since 2006.
- Second, they ask if the respondents themselves have ever been evicted.
- Finally, probe as to the reasons for the eviction, offering predefined options, such as “health issues/medical bills” or “increase in monthly rent or utility bills,” as well as the ability to type in an undefined reason.
After merging the responses with demographics and related outcomes collected through the Feds own Survey on Consumer Expectations, the study covers links between eviction, income, home ownership status and credit access.
EVICTION RATE AND INCOME
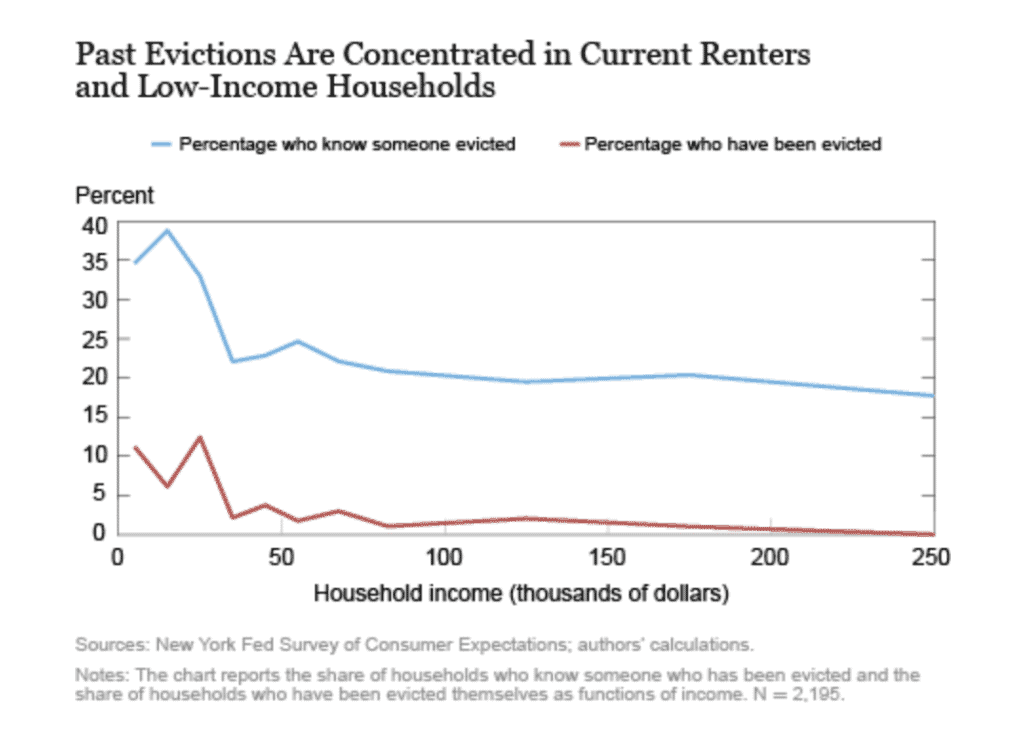
The survey reveals that nearly a quarter of Americans know someone who have been evicted since 2006, with 4 percent of the respondents having been evicted themselves. The rates are higher for renters versus homeowners, with 37% and 21% respectively knowing someone who has been evicted.
As the chart below shows, there is a clear correlation between income and likelihood of eviction. Specifically, about 73 percent of the households who have been evicted at some point have a current income below $50,000. For those with incomes above $50,000, the eviction rate falls to about 3 percent, and continues to decline as income increases.
CAUSES OF EVICTION
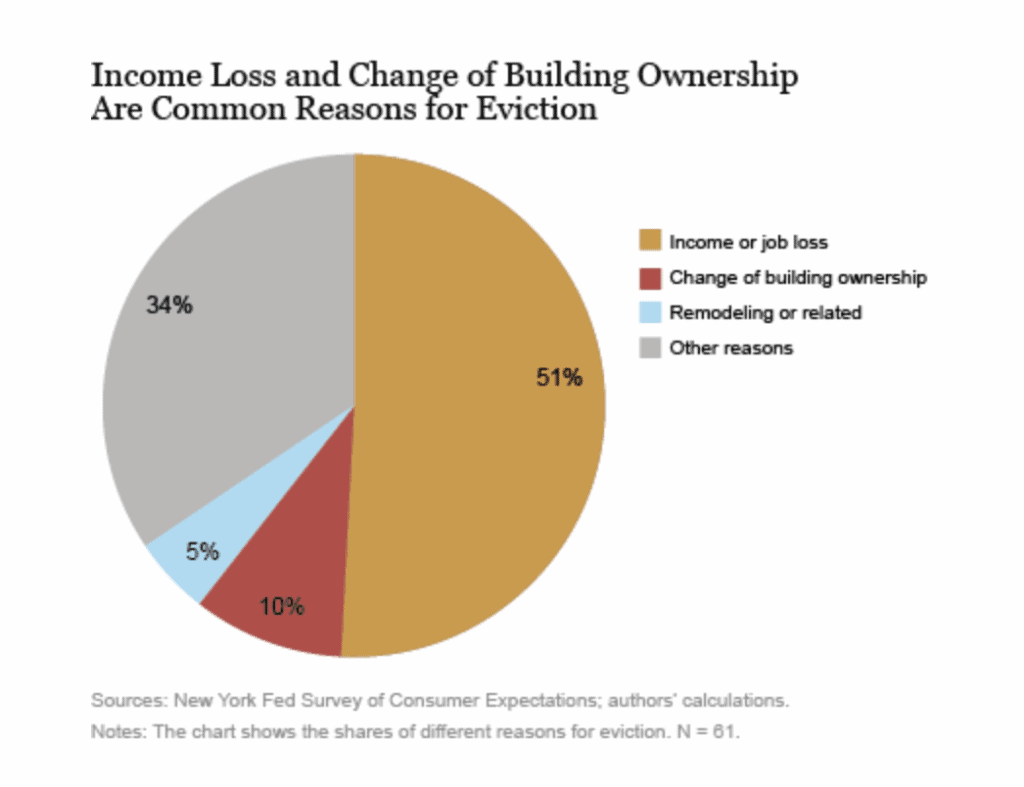
Not surprisingly, as the second chart below shows, more than half of respondents with an eviction history selected either “job loss/unemployment,” reduction in income,” or both as reasons for their eviction.
Next to income loss, the next biggest factor in being evicted (about 15 percent) is driven by property sales, remodeling, or landlords switching the property to a primary residence for themselves. For respondents who were not evicted because of a loss of income, the sale of property by the landlord is the primary driver of evictions.
HOME OWNERSHIP AMONNG EVICTED HOUSEHOLDS
The study found that households with a history of eviction are less likely to be homeowners than other households-with a homeownership rate of 35 percent, versus 74 percent for the full sample. The positive spin on this statistic is that more than one-third of households with past evictions are currently homeowners, suggesting that many evicted households subsequently overcome challenges to become homeowners at some point in the future.
CREDIT ACCESS FOR EVICTED HOUSEHOLDS
Finally, as the chart below shows, the survey covers credit-access results for households, broken down by eviction history and homeownership status. Here is what we learn:
- Current renters with past evictions are less likely to have access to credit cards and auto loans.
- Renters with past evictions are more likely than other renters to apply for credit cards. However, despite applying for more credit cards, they are much less likely to have cards.
- With regard to student loans and eviction history, there is no significant correlation between access to student loans and eviction history. This is explained because student loans are generally not underwritten.
- For homeowners, there is little difference in credit access between those with and without an eviction history. This suggests that once households become homeowners, they enjoy similar access to credit as any household.
EVICTION AND RACE
The Fed’s survey provides evidence that evictions are concentrated in minority communities. Minority respondents are more likely to report that they have been evicted in the past, although this result becomes statistically insignificant when accounting for income and education levels. But minority respondents are 8 percentage points more likely to report knowing someone who has been evicted, a statistically significant result even when accounting for income and demographics.
It’s surprising to realize how common evictions are in the U.S., with the Fed study revealing that about 9 percent of renters have had at least one eviction episode in their lives. We will closely track what, if any, steps federal and local officials take to prevent a new wave of evictions resulting from the COVID-19, economic downturn.
Our next post in this series on Heterogeneity in America focuses on racial disparities in higher education and student debt outcomes.
SOURCES
Andrew Haughwout, Haoyang Liu, and Xiaohan Zhang, “Who Has Been Evicted and Why?,” Federal Reserve Bank of New York Liberty Street Economics, July 8, 2020, 2020, https://libertystreeteconomics.newyorkfed.org/2020/07/who-has-been-evicted-and-why.html.
https://www.cbsnews.com/news/eviction-moratorium-expired-coronavirus/
https://www.washingtonpost.com/business/2020/07/24/faq-federal-eviction-moratorium/
https://www.washingtonpost.com/business/2020/07/24/faq-federal-eviction-moratorium/
https://www.cbsnews.com/news/eviction-moratorium-expired-coronavirus/