Since early 2020, the Recovery Decision Science business intelligence team has covered COVID-19’s impact on the U.S. economy from a variety of perspectives, including:
- WHO BENEFITTED THE MOST FROM FORBEARANCE?
- CONSUMER BEHAVIORS IN FORBEARANCE.
- INCOME INEQUALITY AND THE PANDEMIC THROUGH THE EYES OF MORTGAGE REFINANCING.
With most government support programs ending and the economy rebounding, our BI team will take a fresh look at many issues. In fact, over the following weeks, we will focus primarily on the relationship between the pandemic and the U.S. housing market.
To that end, today, we take a look at the mortgage foreclosure situation during COVID.
In 2020, the percentage of residential mortgages with on-time payment status fell to levels not seen since the Great Recession. But interestingly, due to various governmental and voluntary programs, we did not see a rise in the foreclosure rate in 2020.
LOOKING AT NONCURRENT LOANS
Typically, noncurrent mortgage loans progress toward foreclosure. But in 2020, nearly all noncurrent loans avoided foreclosures, according to a study recently published in Regional Economist and reviewed by the Federal Reserve Bank of St. Louis.
The chart below looks at noncurrent activity for three separate periods:
- 2009, which was the height of noncurrent payments following the Great Recession.
- 2019, leading up to the pandemic, when the economy was strong and growing.
- 2020, capturing the impact of COVID-19 and the related economic shutdown.
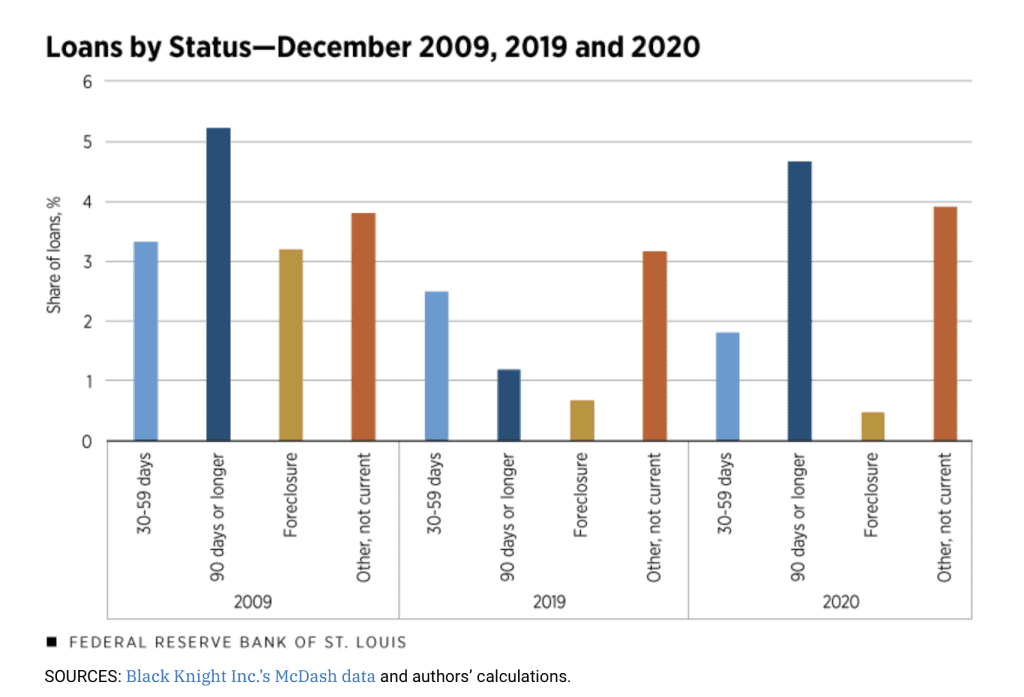
Here’s what we see:
- The percentage of loans 30-90 days past due was about 3.3 percent in 2009, dipping to about 1.8 percent in 2020.
- From 2019 to 2020, the percentage of loans seriously delinquent (90+ days) nearly tripled, as the 2020 rate rose to about 4.8 percent, slightly lower than 2009’s percentage of about 5.2.
- The real story is with the foreclosure rate, which topped more than 3 percent in 2009. But in 2020, about half a percent of all loans went into foreclosure.
UNDERSTANDING WHAT HAPPENED TO NONCURRENT LOANS
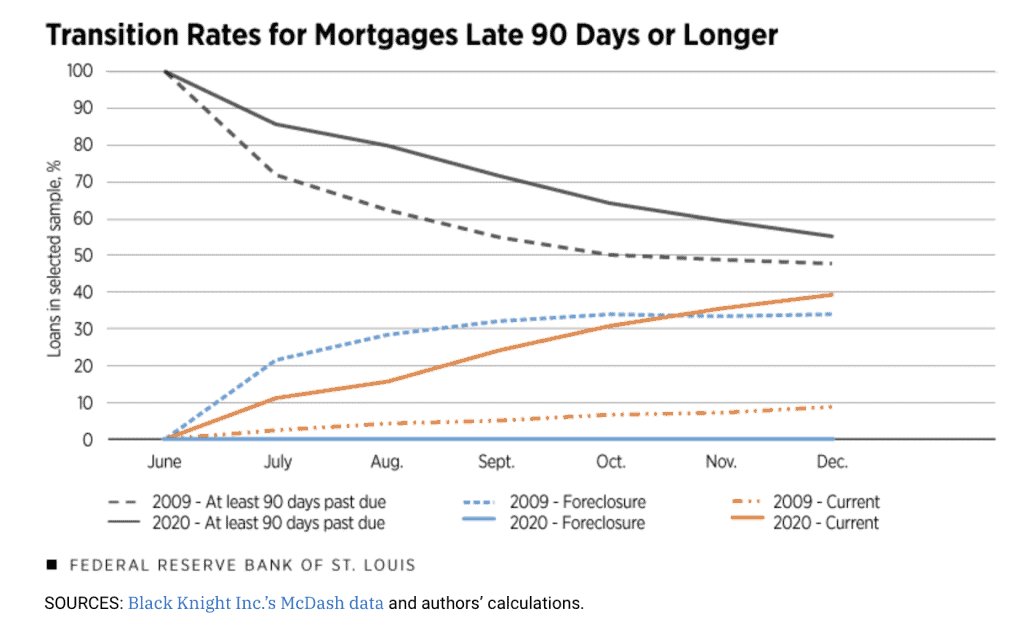
The authors also wanted to explore how quickly noncurrent loans moved into current status for 2020, compared to 2009.
For each year, they looked at current loans in February and were 90 or more days delinquent by June. Then, they charted the 90+ day loans for another six months, or through the end of 2009 and 2020. Here’s what they found:
- 2.8 percent of current loans in February 2020 were more than 90 days late by June. For 2009, 0.7 percent of current loans in February were 90 days or more past due by June of that year.
The question then was: how did those seriously delinquent loans progress over the back half of each year.
We gain some interesting learning from the chart below:
- Looking at the solid orange line, about 40 percent of the loans that were 90+ days delinquent in June 2020 were current by the end of last year. This is almost FOUR TIMES the level seen by the end of 2009.
- Nearly 35 percent of 2009 loans that were 90 days late progressed into foreclosure by the end of that year (blue dotted line). But very few of the same type of delinquent loans in 2020 moved into foreclosure (the solid blue line).
As we see, the level at which mortgage loans moved into 90+ day past due status was roughly the same in 2020 as it was in 2009. But very few of those seriously delinquent loans in 2020 went into foreclosure for several reasons:
- The CARES Act included provisions that suspended foreclosures while also providing for forbearance on federally-funded mortgages.
- The housing market in 2020 was on solid footing compared to the 2009 housing crisis.
- The U.S. economy bounced back more quickly in 2020 than it did in the aftermath of the Great Recession.
In the coming weeks, we will take a closer look at the state of the housing market in the aftermath of the pandemic.
SOURCE
https://www.stlouisfed.org/on-the-economy/2021/september/foreclosure-rates-mortgage-payments-covid19
To learn more about Recovery Decision Science’s Business Intelligence Team, contact:
Kacey Rask : Vice-President, Portfolio Servicing
[email protected] / 513.489.8877, ext. 261