In today’s post, we summarize the findings from a study recently published on the website Social Science Research Network (SSRN). The study looked at the inequality of savings from mortgage refinancing during the early stages of the COVID-19 pandemic.
OVERVIEW
There is a significant amount of scholarly research about the relationship between mortgage refinancing and individual consumption. However, the level of consumption response depends on “the marginal propensity to consume” of those who avail themselves of refinancing opportunities. Fueled by historic low interest rates, we’ve seen a dramatic increase in the amount of refinancing activity in 2020 to date across all income groups. But what’s noteworthy is the degree to which the higher income groups derived significantly greater savings from their refinance activities during the pandemic.
Using original and refinance mortgage data from Freddie Mac, as well as prevailing market average interest rates from the Primary Mortgage Market Survey, the writers document the refinance and savings story from a variety of perspectives.
Importantly, as we will see, refinancing activity during the early months of the pandemic led to dramatic savings advantages for those in the highest income groups.
INTEREST RATES AND REFINANCING ACTIVITY
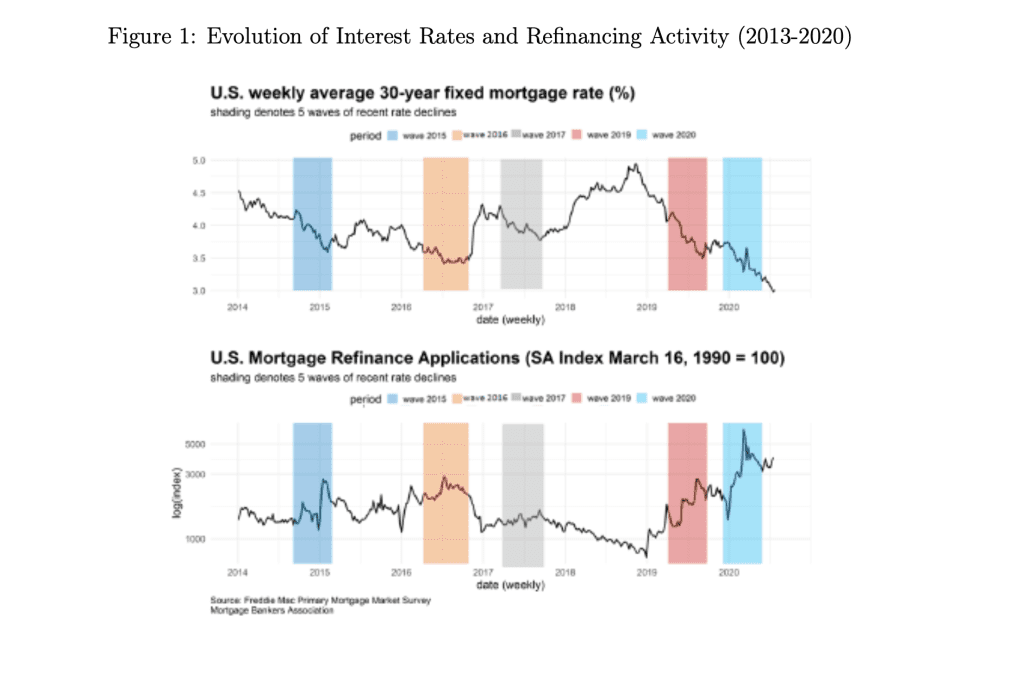
Figure 1 below shows the trend of the 30-year fixed mortgage rates between 2014 and 2020 (top panel). The highlighted blocks indicate 5-month windows with the largest drops in interest rates. For example, during the period of October 2014 through February 2015, there was an 0.64 percentage point (pp) drop between the high and low months. Of the five windows shown the most recent 5-month period, February 2020 to June 2020, saw the largest decrease in interest rates, of 0.77 pp.
Of course, the lower panel shows the impact of those interest rate drops on mortgage refinancing activity. Notably, the greatest amount of refinance activity happened during the February-June pandemic period.
For a detailed, interactive look at interest rates, mortgage applications and refinance activity, check out the RDS Econometrix workbook on our Tableau Public page.
REFINANCING INCOME GAP
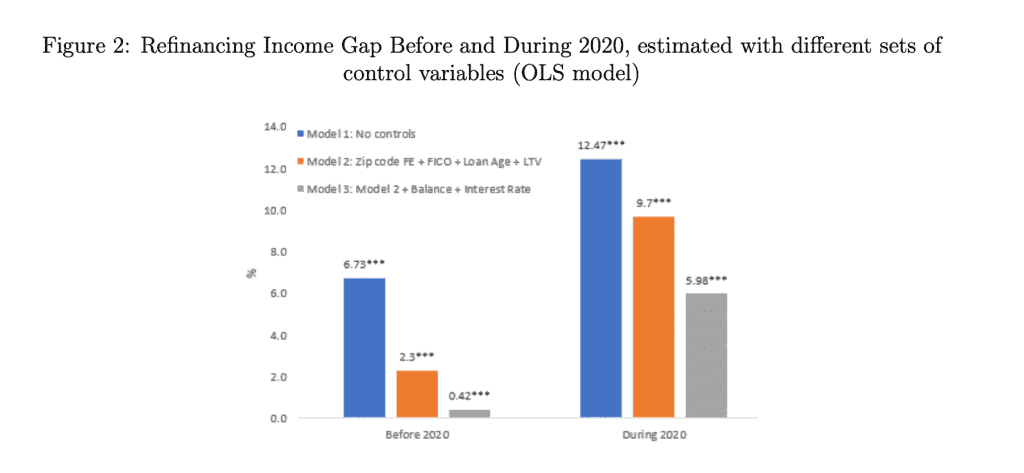
Figure 2 below looks at the refinancing income gap before and during the 2020 pandemic period. This analysis introduces different sets of control variables.
- Zip code FE (Fixed effects)
- Loan age
- FICO scores
- LTV
- Original interest rates
- Unpaid balances
When adjusting for a complete set of variables (gray bar), we can see that the difference in refinancing activity between the top and bottom quintiles of the income distribution was 14 times higher during the pandemic (5.98/0.42).
SAVINGS FROM REFINANCING
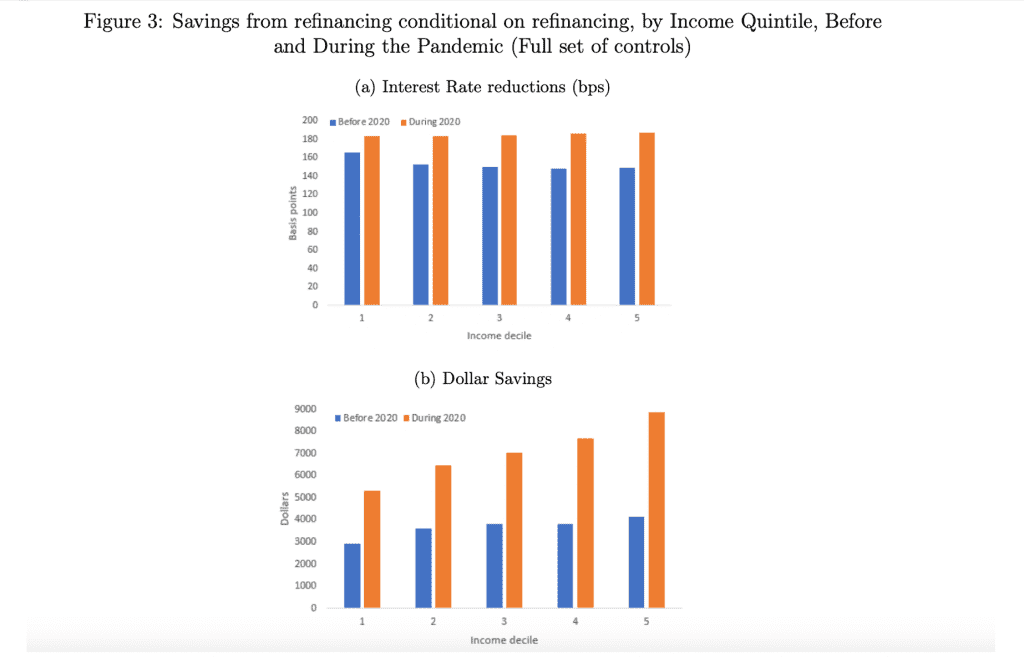
Below are two views of the difference between the highest and lowest income groups. The top panel (a) shows differences in interest rate reductions across all groups. Interestingly, prior to 2020 (blue bar), the lowest incomes quintile actually enjoyed larger interest rate reductions relative to the other income groups. During the pandemic (orange bars), all borrowers received larger interest rate reductions, but the improvement in terms for borrowers in the top quintile of income distribution was larger than for borrowers in the bottom quintile (+36 basis points vs. +16 basis points, respectively). Net, the slight interest rate reduction edge enjoyed by the bottom income quintile disappeared during the pandemic.
The bottom panel (b) looks at the same dynamic, but in terms of absolute dollar savings. Notably, prior to 2020, borrowers in the top income quintile had gained $1,117 more in refinance savings versus the bottom income quintile. But this savings advantage grew by 216% during the pandemic ($3,532/$1,117).
SAVINGS FROM REFINANCING-A DIFFERENT LOOK
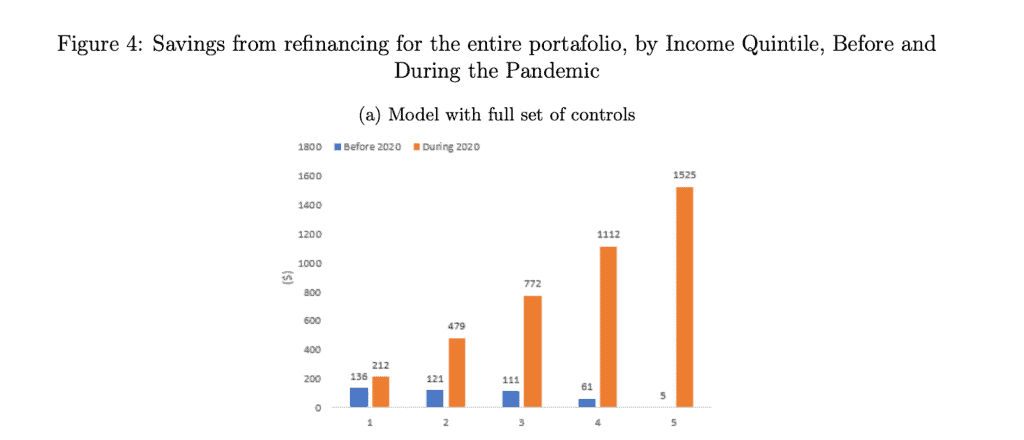
Figure 4 below shows savings from refinancing for the entire portfolio of refinance activity, by income quintile, before and during the pandemic. Notably, prior to 2020, the savings from refinancing (blue bars) were fairly similar across all of the income quintiles. In fact, as you can see, the bottom income quintiles enjoyed a slightly higher savings advantage prior to 2020. However, during the early months of the pandemic, the savings differential from refinancing increased significantly for the top income quintiles. Most dramatic, of course, was with the top income quintile, where the savings from refinancing went from a basis of $5 prior to 2020, to $1,520 during COVID.
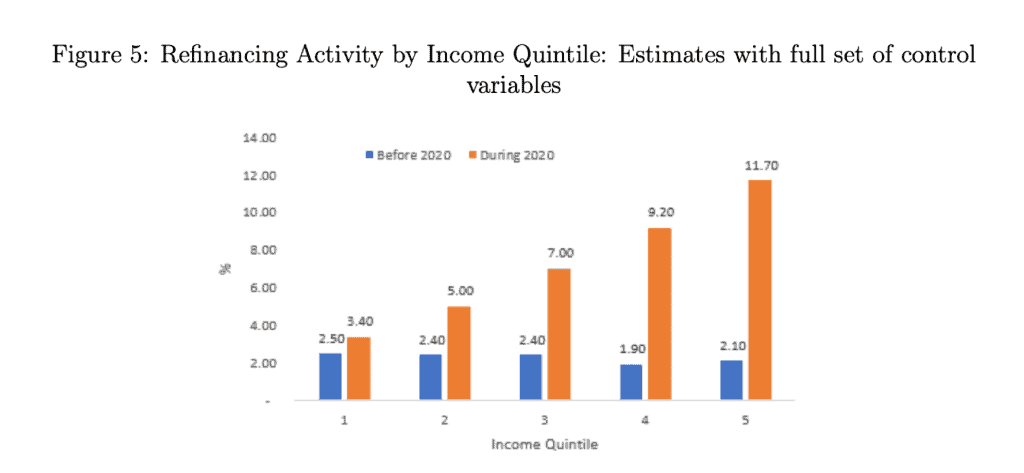
REFINANCING ACTIVITY BY INCOME QUINTILE
Figure 5 below looks at the percentage of refinancing activity by income quintile. Again, the impact of the pandemic is on income inequality is dramatic. While each income quintile saw increased refinance activity during COVID, nearly 12 percent of the top income quintile refinanced during the pandemic, an increase of 960 basis points, compared to a 0.90 basis point increase for the bottom income quintile.
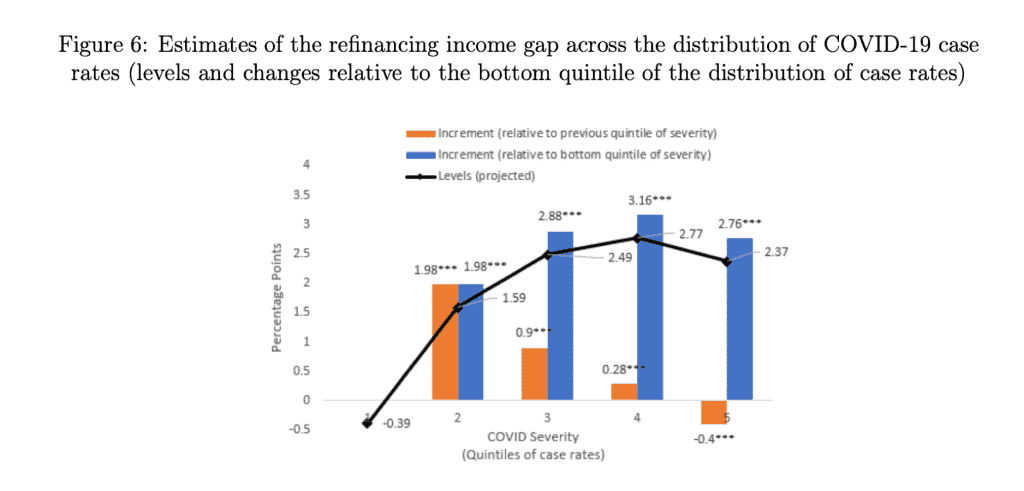
REFINANCING ACTIVITY ACROSS COVID CASE RATES
Finally, the authors look at the impact of COVID severity on the refinancing income gap. Figure 6 below illustrates the evolution of the refinancing income gap across the distribution of COVID severity, using county-by-month case rates as a measure of severity. The black line represents (levels of) the refinancing income gap in county-months that fall in different quintiles of the COVID case rate distribution. The refinancing income gap is defined as the difference in refinancing activity between the top and bottom quintiles of the income distribution. The blue bars represent changes in the refinancing income gap relative to the bottom quintile of COVID case rates. The orange bars represent increments in the refinancing income gap relative to the previous quintile of COVID Severity (i.e. the slope of the black line). Net, refinancing inequality increased by more than 700 percent, moving from the least affected to the most affected (increase of 2.76 from the basis of -0.39 pp)
In summary, the analysis above reveals dramatic differences in the refinancing savings benefits enjoyed by the top income quintiles. In fact, to put this study into greater context, the authors did some “back of the envelope” calculations based on their various analyses. In so doing, they projected a gap in refinance savings of more than $5 billion between the top quintile of the income distribution and the rest of the market
Kacey Rask : Vice-President, Portfolio Servicing
[email protected] / 513.489.8877, ext. 261