Today, we launch an on-going, data-visualization series on the devastating impact of COVID-19 on the American workforce.
Analyzing existing Federal employment data, our team has developed 14 interactive visualizations covering every angle of America’s unemployment story, including:
- Initial claims by month-national and state level
- Initial claims daily average by year-national and state level
- Month over month change-national and state level
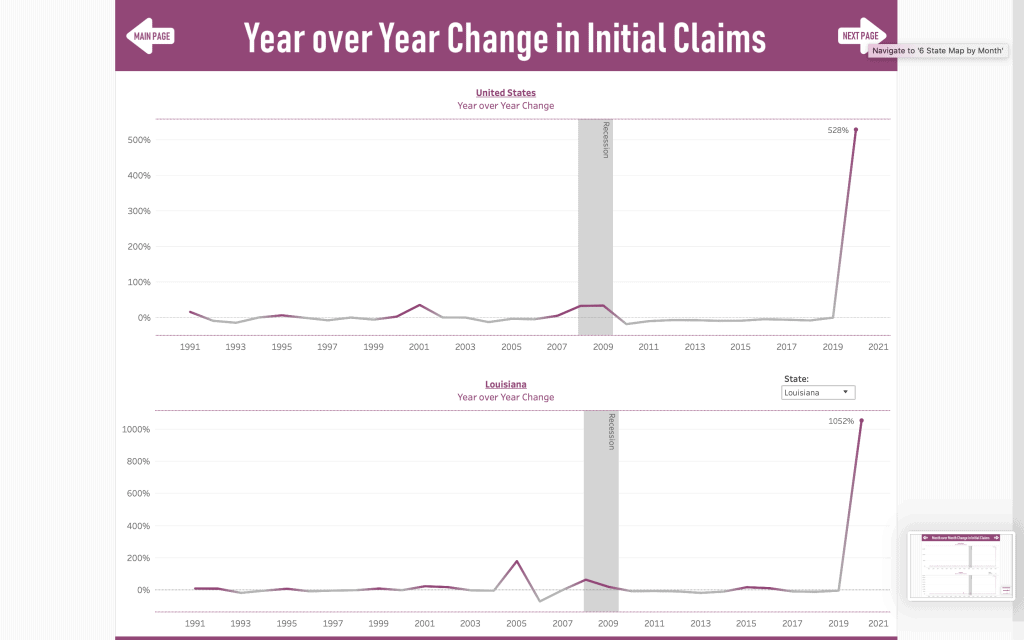
- Year over year change-national and state level
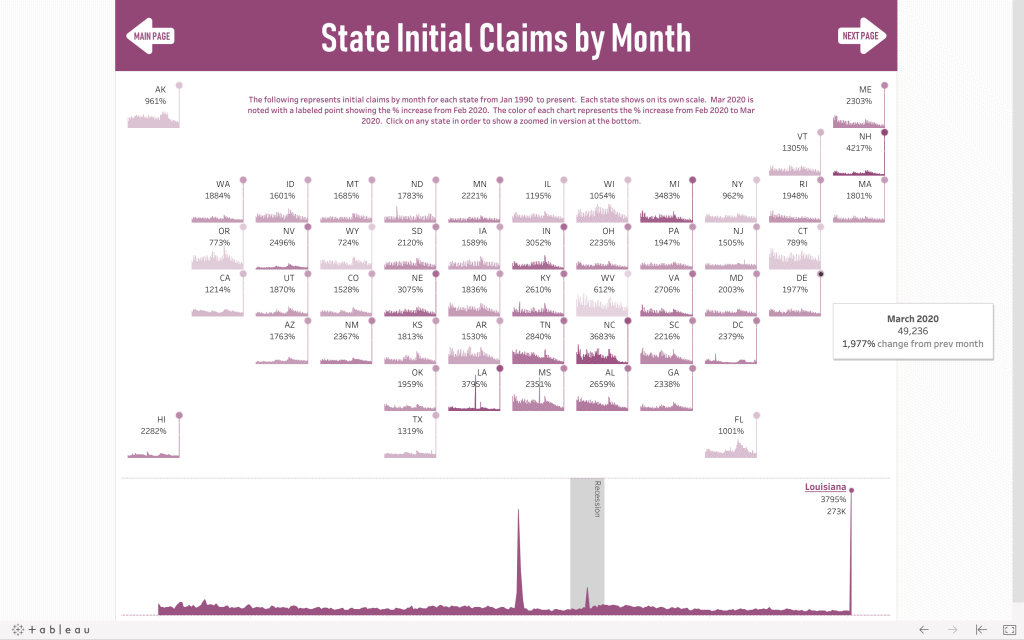
- Claims by state by month
- Daily claims by year and state
- 2019 vs. 2020 change
- 2019 vs. 2020 change by state
- 2019 vs. 2020-state & country comparison
- Unemployment rate by month
- Rates by state by month
- Rates by occupation
- Rates by age range
- Rates by county
Here is a link to the main page of our Unemployment Workbook: https://public.tableau.com/profile/recoverydecisionscience#!/vizhome/UnemploymentClaimsRates/1TableofContents
OVERVIEW
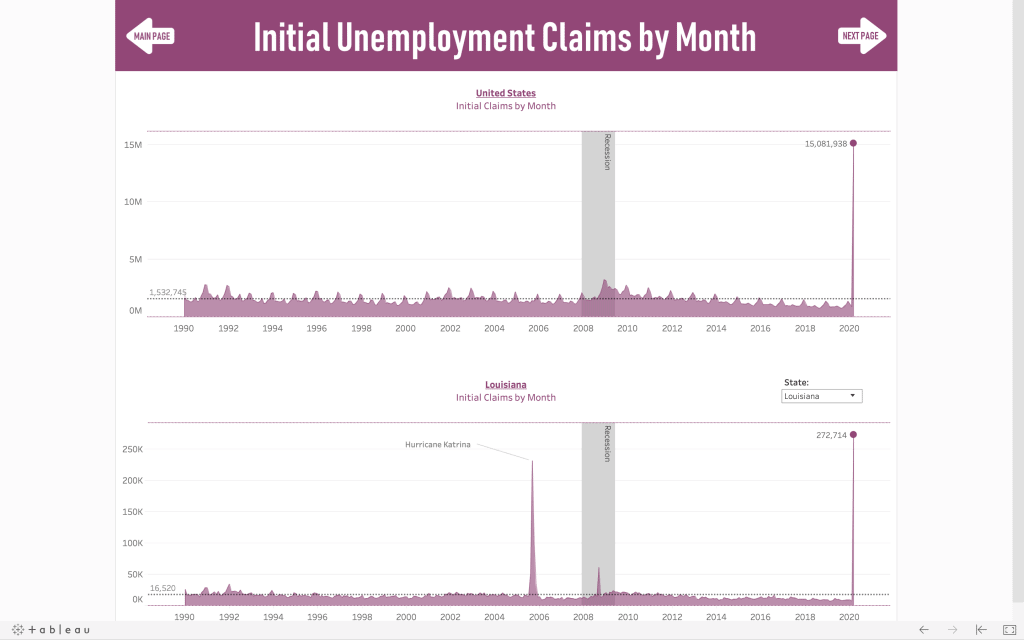
At the height of the Great Recession, in December, 2008, initial unemployment claims hit 3.2MM. As you can see from the graphic below, initial unemployment claims in March, 2020, exceeded 15 MM, a staggering increase of over 500%
As we look at claims on a state-by-basis, per the viz below, we see that New Hampshire had the single greatest month-to-month increase at 4217%. By contrast, West Virginia’s increase from February to March was 612%, the lowest increase in the country. Of course, both of these extremes must be put in context based on their unemployment trends. If you look at West Virginia, you’ll see a consistent level of high unemployment claims over the years, so the increase in March claims is not as dramatic in the absolute. Still, a 612% month-to-month increase in a state with chronic unemployment is tragic.
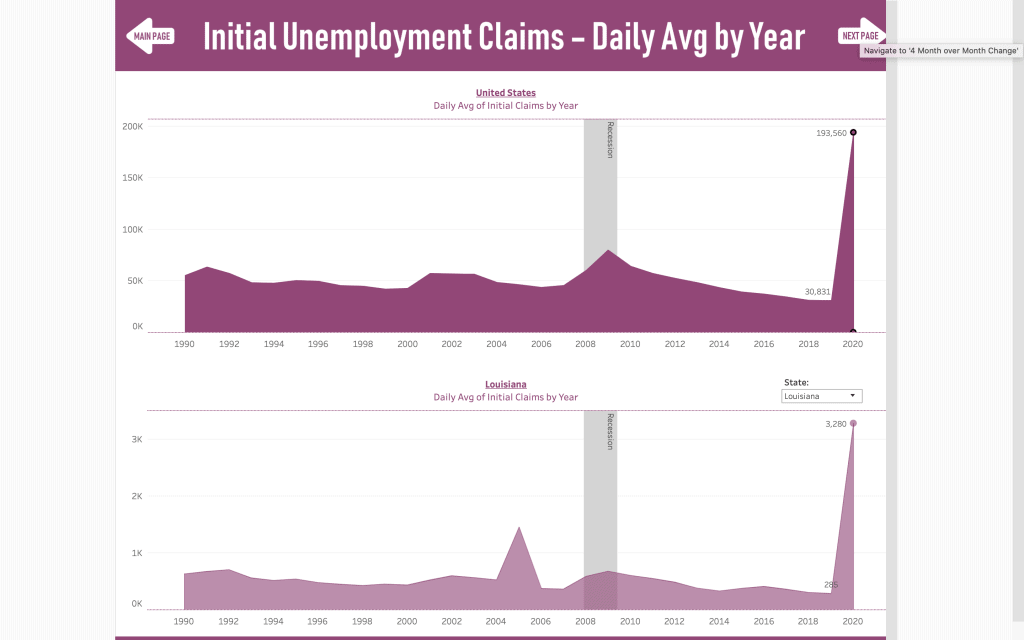
Daily average claims in 2020, to date, are at 193,560, nearly 2 ½ times the daily average of 79,582 in 2008.
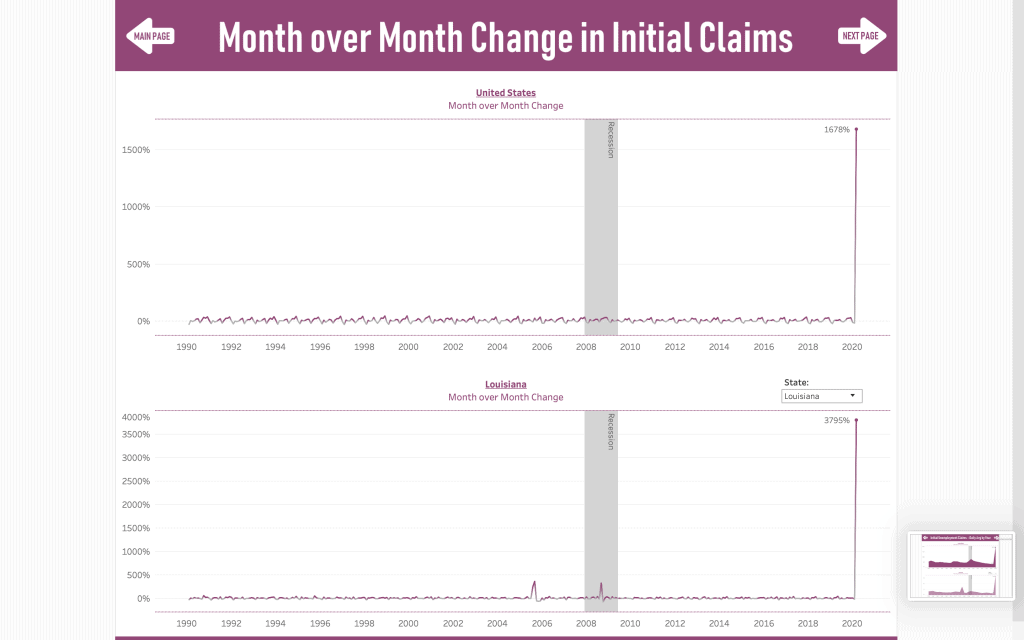
Perhaps the most stunning number is the month-over-month change in initial claims. As you can see below, there was a 1678% increase in initial claims between February and March, 2020. In looking back over the past three decades, the previous month-over-month change in claims was +40%, from November to December 1998.
Finally, to date in 2020, initial claims are up 528% over 2019. The previous year to year high was a 35% increase from 2000 to 2001.
Our current visualizations reflect March data, which showed the unemployment rate at 4.4%. As this is being written, April data was released, showing the national unemployment rate at 14.7%. In that state data lags national by two weeks, we are keeping everything consistent, based on March numbers. We will update all visualizations once the April state data becomes available.
Again, here is our link to the RDS Unemployment Workbook as it stands today: https://public.tableau.com/profile/recoverydecisionscience#!/vizhome/UnemploymentClaimsRates/1TableofContents