RDS recently released Econometrix on its Tableau Public page.
Using interactive visualizations created by our data analytics team, Econometrix looked at the American economy from a variety of angles, including:
- Unemployment
- Real estate: home sales, mortgage rates and mortgage applications
- Household debt
- Consumer loan charge-off predictions and trends
- CFPB consumer complaints
- Credit card debt by generation by state
- Changing balance sheets: Gen X compared to Millennials
Here is a LINK to the Econometrix main page on RDS Tableau Public.
The most expansive section of Econometrix covers America’s unprecedented unemployment situation as a result of COVID-19. In this post, we take a deep dive into that unemployment story, breaking it down demographically, as well as by industry and occupation.
As the reality of the coronavirus pandemic began to take hold in early March, much of the country went into lockdown. This led to a surge in unemployment claims not seen since the days of the Great Depression:
- March: 17,379,183
- April: 15,031,959
- May: 8,062,253
- June: 4,088,068
At its height in April, the national unemployment rate reached 14.7%.
By the end of June, unemployment stood at 11.1%.
For perspective, the national unemployment rate reached 10.0 in October 2009, at the height of the Great Recession.
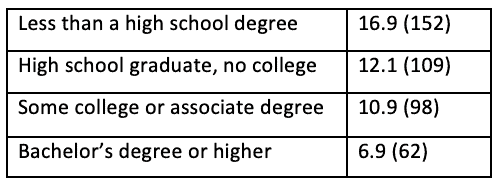
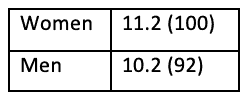
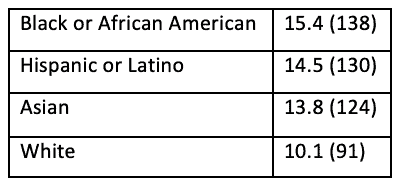
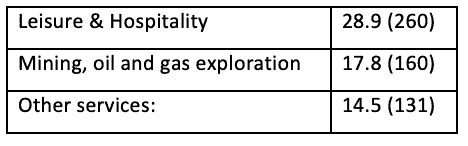
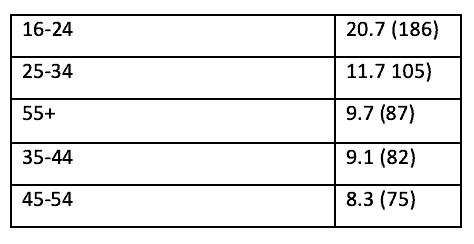
Below, we look at American unemployment from different demographic and occupational perspectives based on the most recent data or June. Each data point is indexed to the current national unemployment rate of 11.1% (100).
UNEMPLOYMENT RATES BY EDUCATION LEVEL
RATES BY GENDER
RATES BY RACE AND ETHNICITY
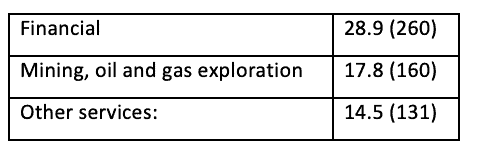
RATES BY INDUSTRY
Highest
Lowest
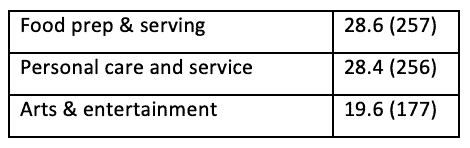
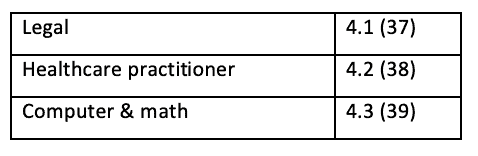
RATES BY OCCUPATION
Highest
Lowest
RATES BY AGE RANGE
Of all occupations and industries, those involving close personal contact, such as restaurants, bars, hair salons and gyms, to name a few, have been disproportionately impacted by COVID-19.
Restaurants, in particular, have been devasted by fears over the virus. Of the estimated 12 million people who work in the food service and restaurant industry (Source: National Restaurant Association), nearly 42% were out of work as of April. Even though the rate has improved over the past two months to June’s level of 28.6%, it is still a staggering figure. To provide context, the highest unemployment rate in the restaurant industry over the past 20 years was 13.9% in January 2010.
As this post is being written, the COVID-19 infection rate is spiking in nearly every state. Many are linking these spikes to the broad re-opening of bars and restaurants, even with social distancing guidelines in place. Many states are now re-assessing their policies with regard to bars and restaurants or any other venue where groups of people can congregate in proximity to one another.
We can expect unemployment rates in food service and restaurants to be in a state of flux in the coming months, and will update our analysis accordingly.
To check out our detailed unemployment visualizations, CLICK HERE.