We’ve updated our CFPB complaint dashboard below.
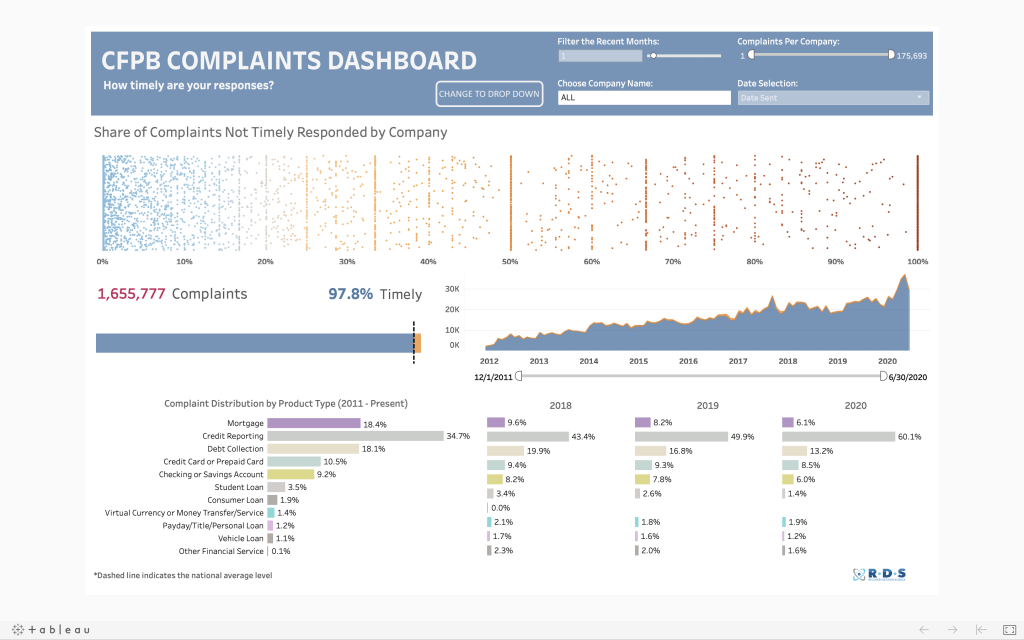
If you are unfamiliar with the dashboard, it includes a company-by-company analysis of response times to complaints to the CFPB. Users can select a company from the pull-down menu. Then, using the dot-plot, you can compare that company to any of the more than 81,000 companies in the CFPB database in terms of timely response to complaints. As you work with the dot-plot, remember that blue is positive, meaning timely responses, and orange is negative.
Users can also do a deep dive on a company’s performance relative to a number of factors:
- Total number of complaints
- Complaints over time
- Percent of complaints that are responded to in a timely manner (i.e. within 30 days)
- Breakdown of product type (i.e. mortgage, debt collection)
- Source of complaint
- And if the consumer disputed the response
As of this date, nearly 1.65 million complaints have been filed with the CFPB.
In terms of performance, 97.8% of these complaints have been responded to in a timely manner (within 30 days). It is worth noting that more complaints were filed in April (34,347) and May (36,658), then at any other time during the previous nine years.
Note that our complaint dashboard gets updated in real time.
CLICK HERE to see the interactive viz on the RDS Tableau Public page