Much has been written about the savings and investment behaviors of millennials and not all of it has been consistent. The Wall Street Journal, for example, expressed concerns that millennials maintain low levels of savings in relation to student loan and credit card debt. The online finance site, NerdWallet, by contrast, suggests that some millennials are saving considerable amounts for their retirement.
Similar conflicting reports surround millennials and home buying. The Real Deal real estate news site reports that millennials are not buying homes. Yet, Business Insider maintains that millennials may put off home buying until they get older, but eventually buy more expensive homes when they finally decide to get into the market.
In an effort to get some clarity on this topic, the Federal Reserve Bank of St. Louis recently undertook a study to compare the financial habits of millennials and Gen X-ers to determine if the former is in a fiscally less sound position than the latter.
Generation X is typically defined as the demographic cohort following the Baby Boom and includes those born between 1964 and the early-1980s. Millennials are more vaguely defined as people born in the period from the mid-1980s to the late 1990s and early 2000s. Thus, many Gen X-ers were entering the workforce in the early part of the new century, while Millennials were entering the workforce in large number around the time of 2008’s Great Recession, giving a basis for comparing financial behavior.
ASSETS AND OBLIGATIONS
According to data gathered by the Fed, millennials hold fewer assets in both financial and nonfinancial terms than Gen X-ers. Total assets held by Gen X-ers averages $198,000 while millennials average $162,000. Millennials also tend to have higher debt levels than members of Generation X, with $72,000 for the former and $67,000 for the latter. The table below compares asset and liability obligations for the two generations.
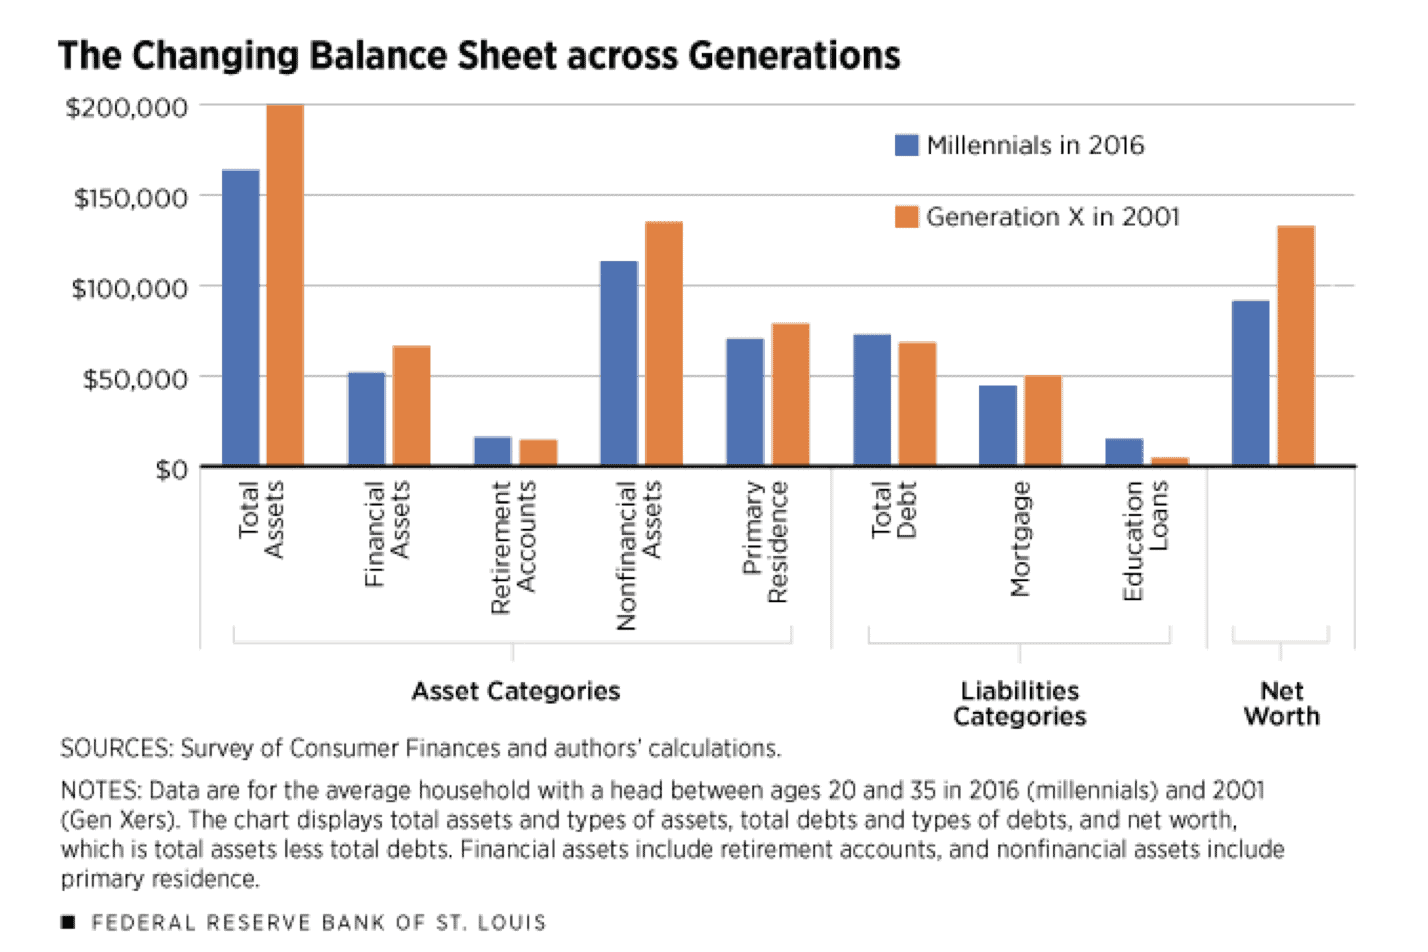
However, the composition of debt differs between millennials and Generation X. The rising costs of secondary and post-secondary education are evident in the amount of student loan debt carried by millennials, which averages $14,700 as compared to only a $4,200 average for members of Gen-X.
In some categories, millennials fare better than their elders. Credit card debt for the average millennials is $1,800, according to the study, while the average Gen X-er carries $2,700 in debt. Further, millennials hold a slight advantage in retirement assets, showing $15,500 average in relation to $13,600 per Gen X-er.
LOWER NET WORTH
In the intervening years between when Generation X entered the workforce and when the millennial generation entered, prices of some asset categories may have changed significantly. To account for such differences, in the figure below, the Fed computed the ratio of the average value for each generation to the average of all households in those respective years. These ratios are best interpreted as a percentage of the average value for ALL households. For example, a ratio of 0.2 indicates that the generation in question held assets or liabilities equal to 20 percent of the average value across all households in that year.
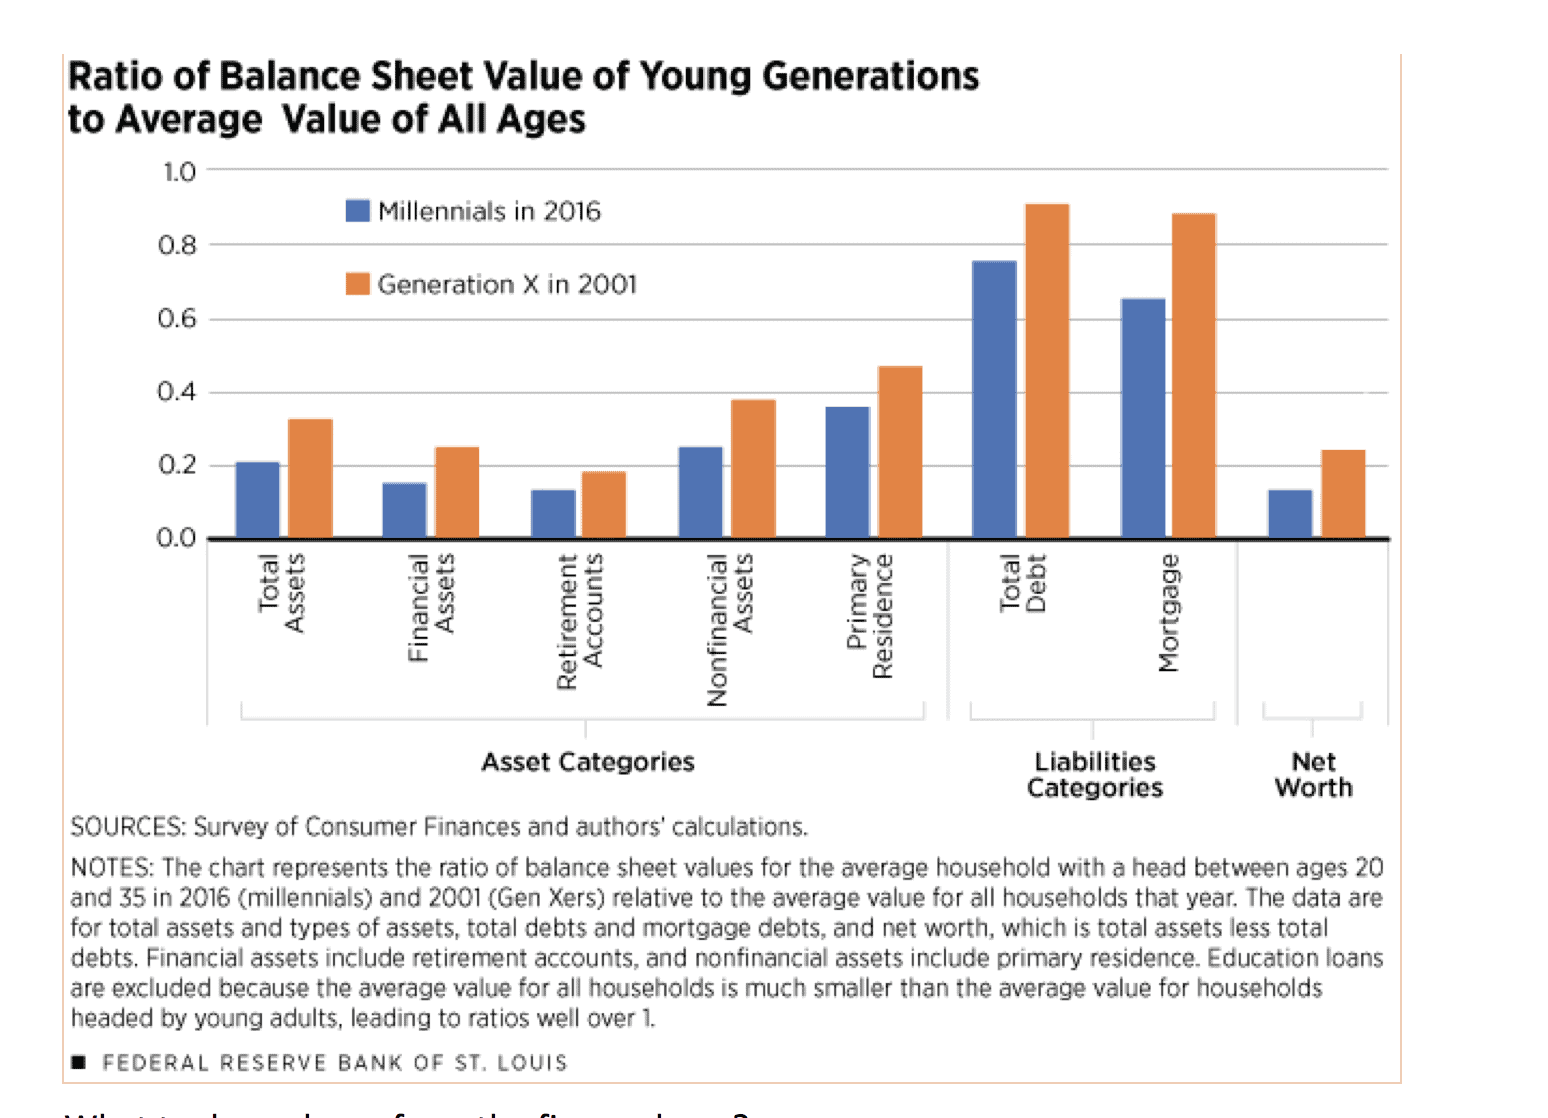
What to do we learn from the figure above?
- Relatively speaking, millennials had a significantly smaller asset ratio (21 percent) than Gen-Xers (32 percent). The financial assets, nonfinancial assets and housing ratios for millennials each dropped about 10 percentage points, and the retirement account ratio fell by about 5 percentage points.
- The average debt ratio was lower for millennials. Millennial debt ratio was around 15 percent compared to that of Generation X, which is about 23 percent. In large part, this gap is likely driven by differences in interest rates, most notably mortgage interest. Gen-X home buyers paid mortgage interest rates in the 8-10 percent range. By contrast, millennials entering the housing market in the post-recession economy enjoyed mortgage interest rates as low as 3-4 percent.
- Millennials have a lower net worth as a function of holding fewer assets while maintaining higher debt loads. But the Fed is quick to point out that this is “not necessarily an indictment of millennials’ spending and savings habits, as much a reflection of our changing society.”
- The labor participation rate for 20-24 years olds dropped to 70.5 percent in 2016, from 77.1 percent in 2001.
- During the same period, the share of those 25-29 with four years of college (and associated debt) increased from 28.4 percent to 36.1 percent.
- A higher percentage of young adults live with their parents and are getting married later in life. Both factors contribute to the likelihood that millennials put off housing purchases to later in life. Still, it is interesting to note that, according to a report by CNBC, more than 70 percent of millennials say they regret buying a home. They cite both having to overspend for a down payment and underestimating the cost of maintaining a home. It remains to be seen if these attitudes have any long-term impact on the housing market.
In assessing the overall financial health of the millennial generation, the Fed concludes:
“While millennials hold higher levels of student loans, education is often an investment that improves productivity and future earnings. Given these considerations, the concerns regarding millennials’ spending and saving habits may be at least partially eased, as they will likely have more time in the labor force to accrue assets and pay off their debts.”
SOURCES
https://www.cnbc.com/2018/07/18/most-millennials-regret-buying-home.html