In the RDS blog, we frequently discuss the issue of student debt and the ramifications for borrowers.
The spectacular growth in student loan debt has been due to an increase in both average balances and number of borrowers. Between 2008 and 2018, the average balance per student loan borrower grew at about five percent per year and the U.S. total is now around $1.5 trillion.
In this post, we turn to the Federal Reserve Bank of New York, which used data from its Consumer Credit Panel (CCP) to examine borrowing and repayment by neighborhood income. The CCP is an anonymized, representative panel of individual-level credit reports and loan-level student loan data from Equifax. Income information is not reported on credit reports, so the Fed classifies individuals by the average adjusted gross income in their zip code using data from the IRS Statistics of Income from 2016. Individuals are then grouped according to zip code-income quartiles that have equal populations in each group.
Student loan borrowers, who generally are young, do not have substantial borrowing experience and typically have lower (or no) credit scores. Relying upon the income or repayment history of parents to underwrite loans would undermine the program’s purpose. Thus, the student loan program distributes loans to borrowers across the income spectrum without regard to creditworthiness.
Accordingly, the number of borrowers is distributed nearly equally across the zip code income quartiles, with between 10 and 11 million borrowers in each group. The chart below depicts the number of student loan borrowers by the income-quartile of their zip code and their total balance owed.

Although high-balance borrowers are only seven percent of the 43 million borrowers, their balances add up: They owe 35 percent of the aggregate student loan debt. High-balance borrowers are a bit more likely to live in high-income areas, and it is their debt that tilts the outstanding balance toward the wealthier zip codes.
Next, we show the aggregate outstanding balance, and its composition by borrower zip code-income quartile.
Given the wide gaps in income and educational attainment in the US across income quartiles, it is surprising that the average balance is relatively constant. Average balances per borrower are higher by about $9,000 in the fourth quartile compared to the first. But, this difference in average balances is dwarfed by the differences in income across the distribution: The average income of the top quartile is more than three times that of the bottom, implying large differences in the debt-to-income ratios for the average borrower in each group.
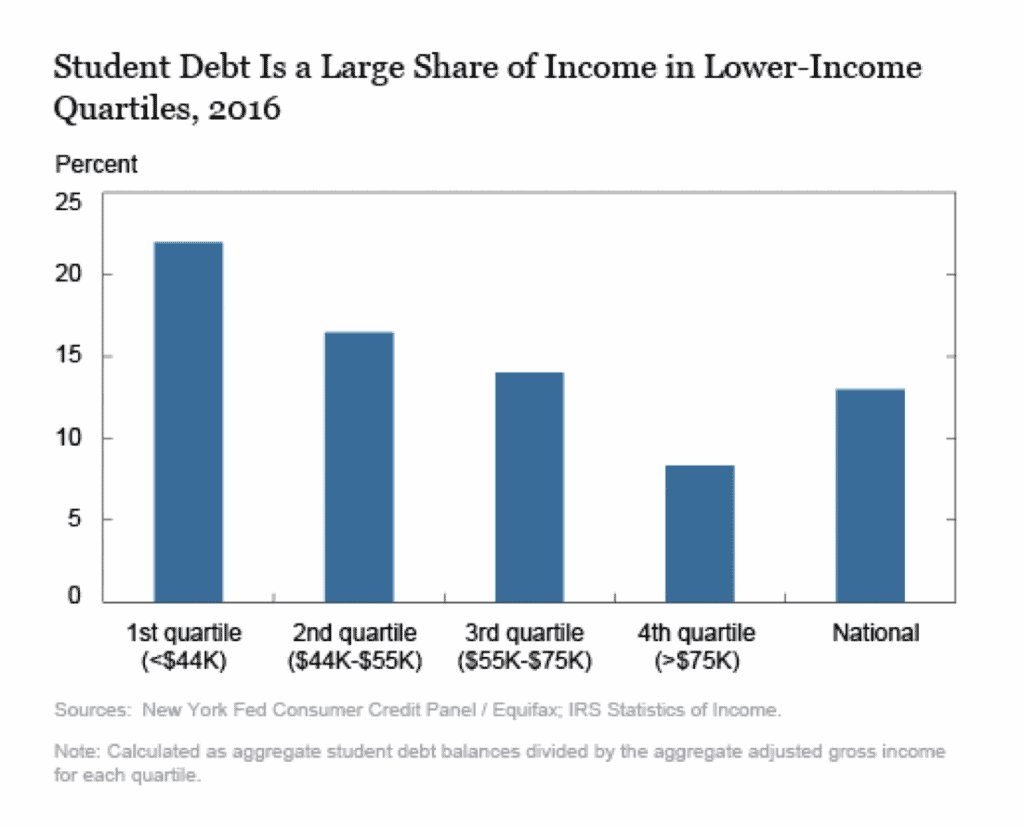
In 2016, the most recent year for which the Fed has income data, the aggregate student loan balance was 22 percent of the aggregate income for the first quartile, but eight percent of the average income for the wealthiest quartile.
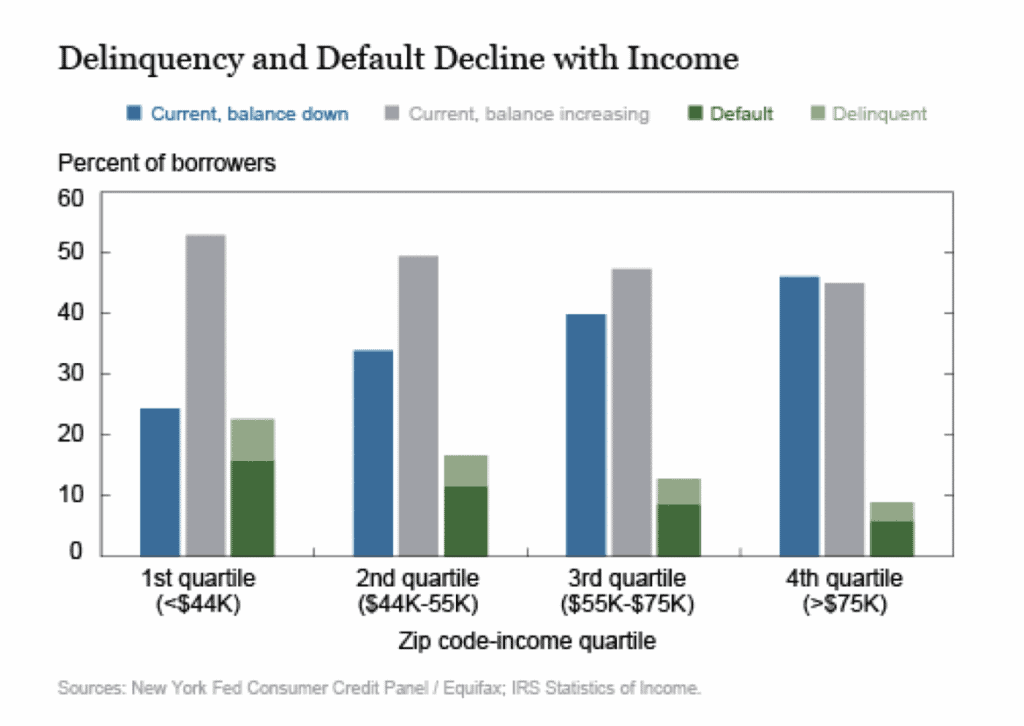
Consequently, borrowers from less affluent areas are more likely to struggle with repayment and have higher delinquency rates. As shown in the chart below, delinquency rates for student loans decline with the level of income in a particular zip code.

In the top quartile, just over nine percent of borrowers are 90 or more days past due or in default on their student loan, notably lower than the 23 percent rate seen in the first quartile. Although delinquency rates in the high-income areas are lower, there remains a very large share of borrowers who have not reduced their balances in the period from the second quarter of 2018 to the second quarter of 2019.
This category of borrowers may include those who are either still enrolled, have recently graduated, or are on some type of repayment plan through which their monthly payments are insufficient to offset the accruing interest.
Although the share of borrowers in the “balance not declining” category edges slightly lower as incomes increase, it should be noted that a surprisingly large share, shown in gray, of borrowers are not actively reducing their balances even in relatively wealthy areas.
SOURCE
https://libertystreeteconomics.newyorkfed.org/2019/10/who-borrows-for-collegeand-who-repays.html
