In the spring of 2020, as the COVID-19 pandemic began to ravage the U.S. economy, the Recovery Decision Science Business Intelligence team introduced Econometrix on the RDS Tableau Public page.
Through the use of interactive data visualizations, Econometrix provides an in-depth analysis of the economy from a number of angles:
- Unemployment: In the early months of the pandemic, as many states went into lockdown, millions of Americans lost their jobs, especially in business sectors such as restaurants, where unemployment reached 41.8% in April. Our Unemployment Workbook breaks down the unemployment story through 18 different national, state and demographic visualizations.
- Housing: Fueled by historically-low mortgage rates, the housing marketing continued to be hot. Our Econometrix workbooks look at long-term trends in mortgage rates, mortgage applications and new home sales.
- Consumer Loan Charge-Off: Every quarter, the Business Intelligence team updates RDS’s predictions for consumer loan charge-offs, that we then translate into an interactive visualization.
- CFPB Complaints: RDS has been charting complaints made to the CFPB for a number of years. The viz looks at timeliness by which thousands of companies respond to complaints, as well as trends by type of complaint (credit rating, mortgage issues, etc.)
- Household Debt: We visualize and break-down U.S. debt trends by for mortgages, college loan, automotive loans and credit cards.
One area of the U.S. economy that is of particular interest to the B.I. team is the cost of going to college, given the continue rise in college debt over the past decade.
The B.I. team recently launched the first in what will be a series of interactive visualizations related to the cost of getting an education in the United States: The Rise in College Pricing.
THE RISE IN COLLEGE PRICING: 1972 TO 2020
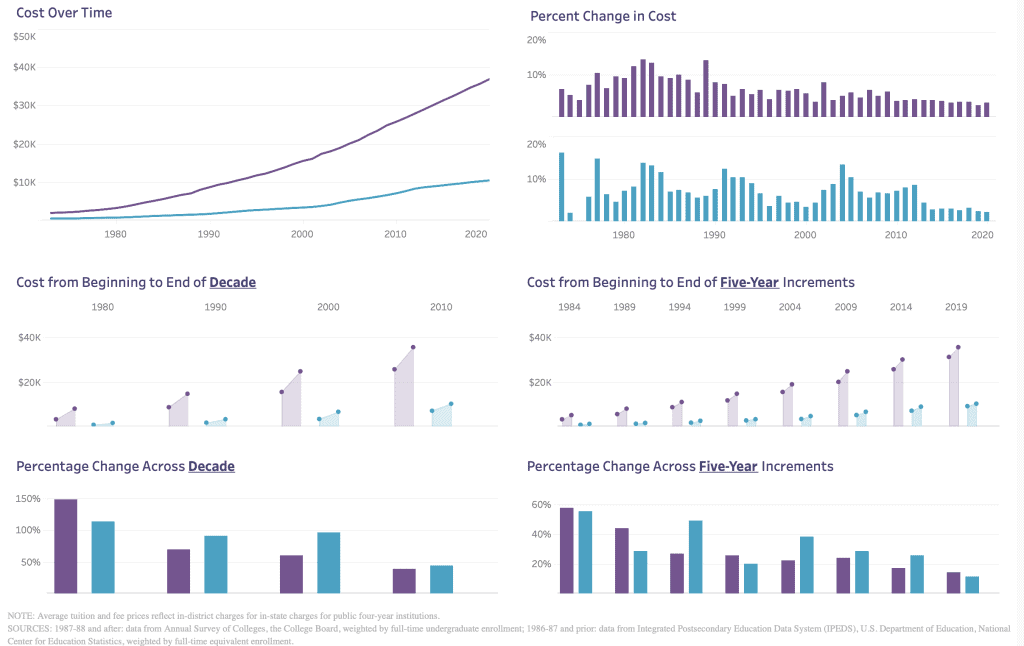
As the screenshot indicates, the team looked at the six different trends in tuition pricing for both private, four-year, non-profit and public, four-year institutions:
- COST OVER TIME: Between 1973 and 2020, tuition at 4-year, private, non-profit schools increased by a factor of 18.5 times, compared to a 10 time increase for 4-year public schools.
- PERCENTAGE COST OVER TIME: The 1980s were a boom time for private schools in terms of tuition increases; public schools had bursts of tuition increases that last until the 2000s.
- COSTS FROM BEGINNING TO END OF A DECADE: Private school tuition had its greatest increase during the most recent decade, rising $10,000 between 2010-2020.
- PERCENTAGE CHANGE OVER THE DECADES: During the 1980s, tuition at private, 4-year schools rose 148%; public school tuition rose 114% during the same decade.
- COST TO BEGINNING TO END IN FIVE YEAR INCREMENTS: Both private and public schools had their greatest cost increase during the 5-year period from 2014-2019.
- PERCENTAGE CHANGE ACROSS FIVE-YEAR INCREMENTS: The rate of tuition increase was greatest for both types of school in the period spanning 1979-1984.
CLICK HERE to experience the interactive data visualizations for each of these areas of tuition pricing trends.
To learn more about Econometrix or the entire suite of RDS analytics tools contact:
Kacey Rask : Vice-President, Portfolio Servicing
[email protected] / 513.489.8877, ext. 261