Since the earliest days of the pandemic, we’ve been blogging about Federal Reserve reports on how the economic impact of COVID has played out on a demographic basis. In particular, the Fed has written extensively about how the pandemic has exacerbated the already high levels of income inequality.
Building off of these themes, the Fed recently launched a multi-part series: The State of Low Income America.
In today’s post, we look at credit access and dept payment as the pandemic enters its third year.
In particular, the Fed takes a close look at how those at the lowest end of the income scale have fared, and what they might be facing now that most moratoria and government supports are ending.
THE PANDEMIC’S TOLL ON LOWER-INCOME AMERICANS
On a certain level, the financial situation for lower-income Americans is promising. As the Fed points out in this report:
- 2021 saw the strongest year of economic growth in nearly 40 years.
- The Supplemental Poverty level dropped 2.6 percentage points to 9.1%
- The overall employment levels approached their pre-pandemic level by the end of 2021.
However, while these are positive notes, there is no question that lower-income Americans bore the greatest brunt of the pandemic. They suffered through a higher rate of infections and serious illness. The early, and staggering unemployment in 2022 primarily hit the lowest income wage earners, especially those in hourly-wage service jobs. And, of course, while employment has returned to pre-pandemic levels, we are in the midst of inflation levels that haven’t been seen in four decades.
With that as a backdrop, we look at credit access and debt challenges across the income spectrum for American adults.
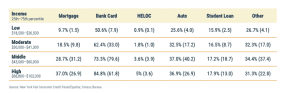
CREDIT HOLDINGS
As we see in the chart below:
- The prevalence of both auto and student loan debt is fairly consistent across all income groups.
- Less than 10% of low-income adults hold a mortgage, compared to 37% of the highest income households.
- Far and away, credit cards represent the single, largest credit product across all income groups.
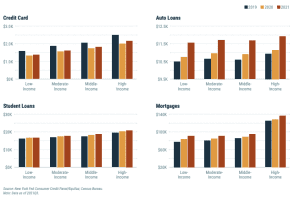
DEBT HOLDINGS
The chart below breaks out actual debt holdings by income group and product over a three-year period. Here’s what we see:
- Mortgage balances represent the largest debt holding for all income groups.
- Credit card debt fell significantly between 2019 and 2020, indicative of the fact that people were not spending as much because of the lockdown. Plus, COVID support payments helped many consumers pay down their credit card balances. While credit card balances inched up in 2021, they still remain lower than in 2019.
- There were significant increases in auto debt across all income groups over the past three years, with the largest increase in 2021. This increase in auto loans was primarily driven by historically-low interest rates combined with government support.
FINANCIAL STRESS
In this section, we’ll look at various measures of financial stress.
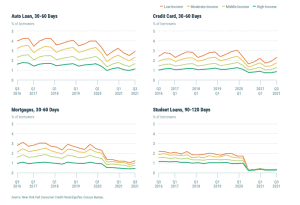
Early Delinquencies
First, we examine early delinquencies by income group and product. The chart below shows us:
- Student loan delinquencies were essentially eliminated for all income groups during the pandemic, reflecting the prevalence of repayment moratoria on student loan debt.
- Mortgage delinquencies equalized in the year following the COVID shut-downs. Low and moderate-income groups enjoyed improved payment rates, plus, these groups benefitted from widespread forbearance policies.
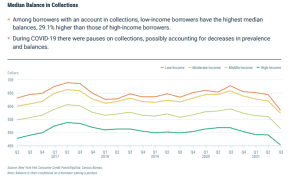
Median Balances in Collections
Below we look at accounts in collection. All income groups benefited from pauses in collections during COVID-19. Still, those borrowers in the lowest income group maintain a balance in collections that is 29.1% higher than the highest income borrowers.
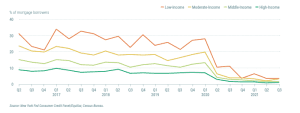
New Foreclosures
The chart below shows us the level of new foreclosures dating back to 2017. In general, new foreclosures have declined since the Great Recession. But here’s what we see:
- In the years leading up to the pandemic, there were nearly three times as many low-income mortgage borrowers with new foreclosures, compared to the highest income borrowers.
- New foreclosures essentially stopped with COVID. This primarily reflects the fact that the economic fundamentals were strong during this period. Specifically, we had strong income growth, as well as rising home prices. Plus, interest rates were at historic lows.
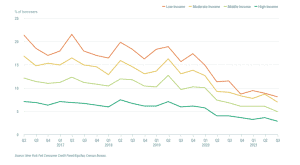
New Bankruptcies
Finally, we look at new bankruptcies in the chart below. Here’s what we see:
- Bankruptcy filing was significantly more prevalent in low-income areas, often four-times the level of high-income bankruptcies.
- New bankruptcies declined dramatically since the start of the pandemic, especially for those in the lowest income groups.
In our next post, we’ll look at the special Fed report on student loans, before during and after the pandemic.
SOURCE
https://www.newyorkfed.org/medialibrary/media/press/the-state-of-low-income-america-credit-access-debt-payment-march-2022
To learn more about Recovery Decision Science contact:
Kacey Rask : Vice-President, Portfolio Servicing
[email protected] / 513.489.8877, ext. 261