The Federal Reserve Bank of San Francisco recently took a look at an old-school way of paying for goods: Cash.
The Fed’s 2019 Diary of Consumer Payment Choice (Diary) highlights findings from the fifth such Diary study. A demographically-representative sample of 2,873 individuals participated in the study and reported all of their payments and transactions over three consecutive days, staggered throughout October 2018.
In 2018, Diary participants made an average of 1.4 payments per day, or, on average, daily payments equatedto approximately 43 payments per month. This marks the first time participants reported debit cards as the most frequently used payment instrument, accounting for 28 percent of payments. As indicated on the chart below, cash was second, used 26 percent of the time. Consumers’ credit card usage has steadily increased from 2016 to 2018, rising from 18 percent to 23 percent.
Share of Payment Instrument Usage by Year
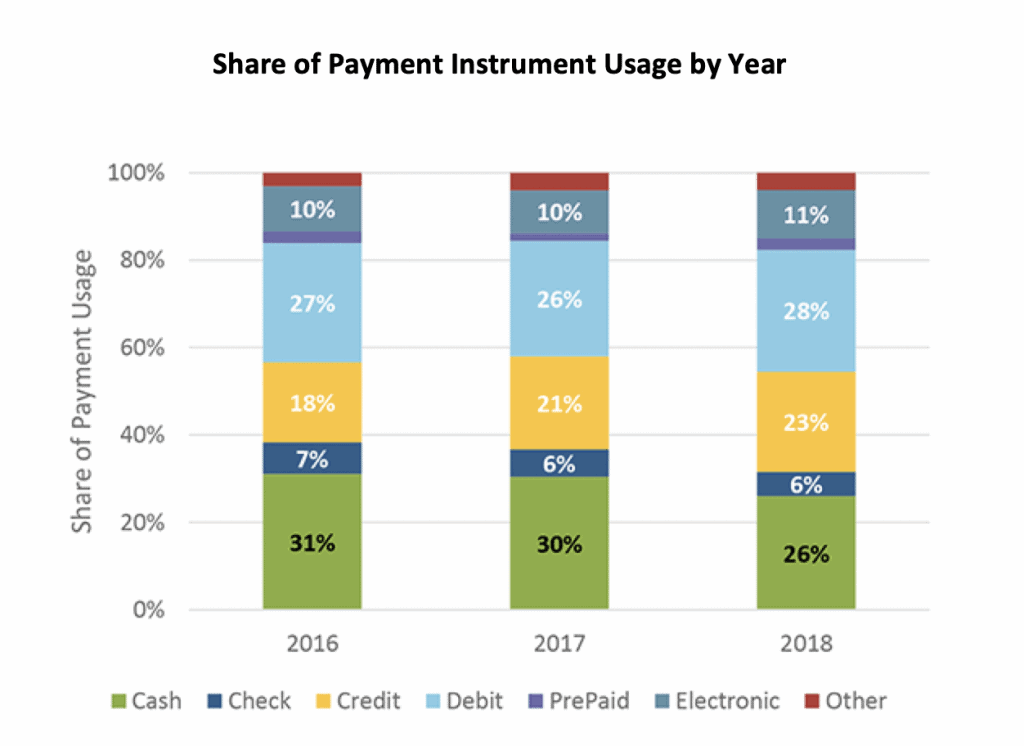
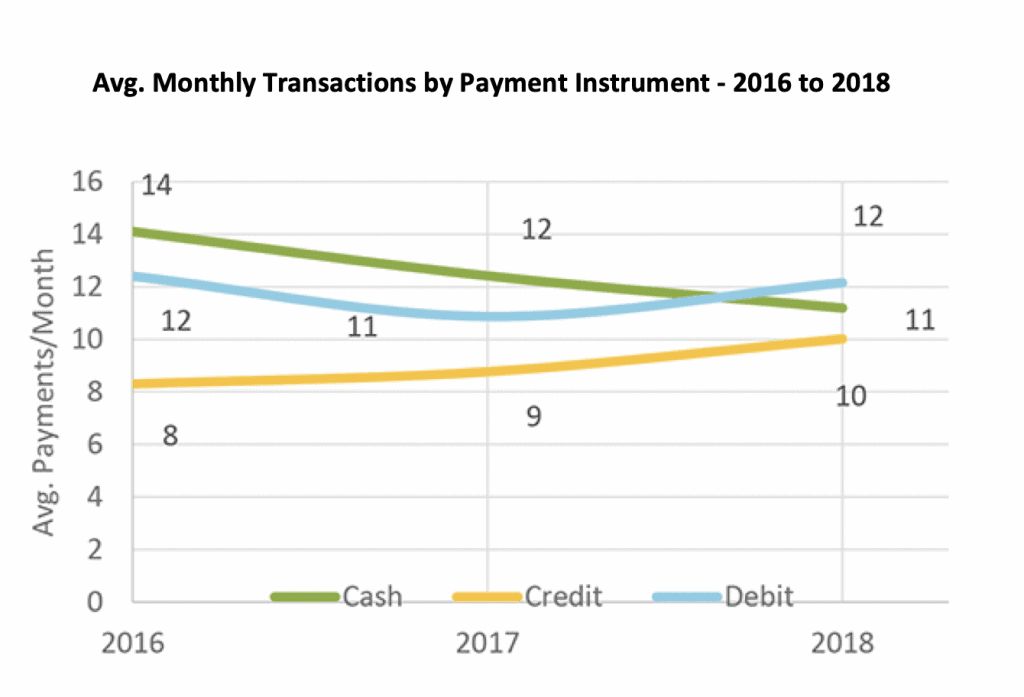
Cash’s share of payments declined four percentage points from 2017, a change that results from two factors: Diary participants’ cash use declined by one payment per month and their total payments increased from 41 to 43 payments per month. As demonstrated below, the average number of debit transactions remained steady between 2016-2018, ranging between 11 and 12 payments, while credit card usage increased from eight to 10 payments.
Avg. Monthly Transactions by Payment Instrument – 2016 to 2018
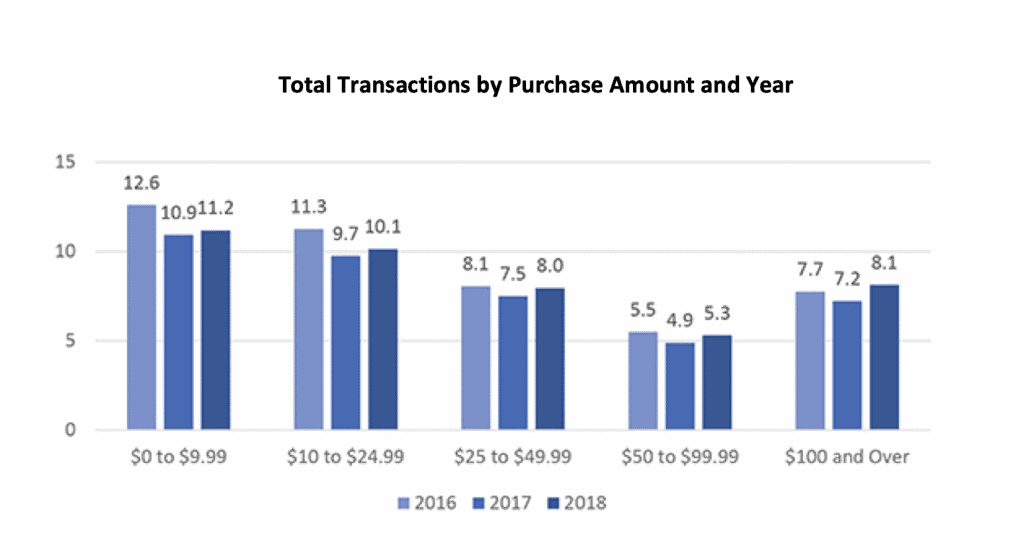
Of all payments reported in the 2018 Diary, approximately 50 percent were less than $25 and approximately 25 percent were less than $10. This equates to consumers making 21 payments a month that were less than $25 and only 13 purchases greater than $50 (see below.).
Total Transactions by Purchase Amount and Year
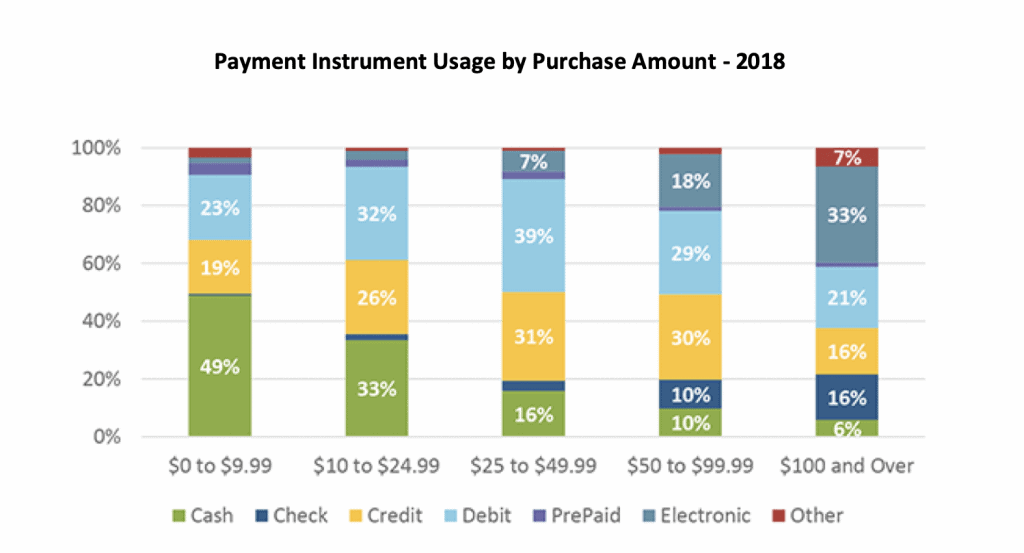
Of all the cash payments reported, 80 percent were for payments below $25, illustrating why cash continues to be a popular payment instrument.
However, the share of cash payments has been decreasing. The 2018 Diary represents the first year that cash was not used for the majority of transactions under $10. In 2017, 56 percent of payments under $10 were conducted using cash while data from the 2018 Diary show that share declined to 49 percent, though cash was used more than twice as often as debit cards.
In the $10 to $24.99 payment range, cash and debit card usage are nearly identical at 33 and 32 percent, respectively. Checks and electronic payments are used more frequently for purchases above $100 – a price range more often associated with bill payments.
Payment Instrument Usage by Purchase Amount – 2018
Participants’ 2018 payment preferences remained similar to those stated in 2017. Most participants prefer to pay with debit cards (42 percent), while the next largest group prefer to pay with credit cards (29 percent); both shares remain unchanged from 2017.
Cash is the third most preferred payment method, with 22 percent of participants reporting it as their primary way to pay for goods and services. The preference for cash has decreased over the last three years, most recently declining by two percent from 2017.
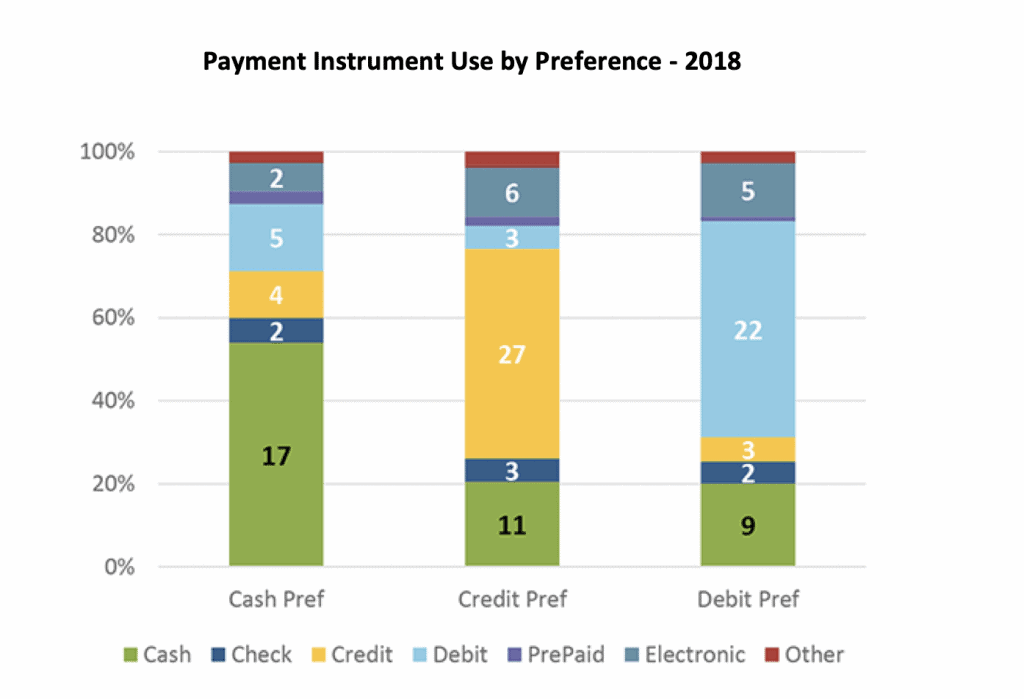
Consumers’ stated payment preferences closely align with their payment habits. Diary participants used the payment method they identified as their most preferred for the majority of their payments. Cash-heavy consumers used debit and credit cards as a backup payment at nearly equal rates, shown in the table below.
Conversely, consumers who preferred to pay with credit or debit cards infrequently substituted between other payment cards and instead used cash more commonly as their backup payment method.
Payment Instrument Use by Preference – 2018
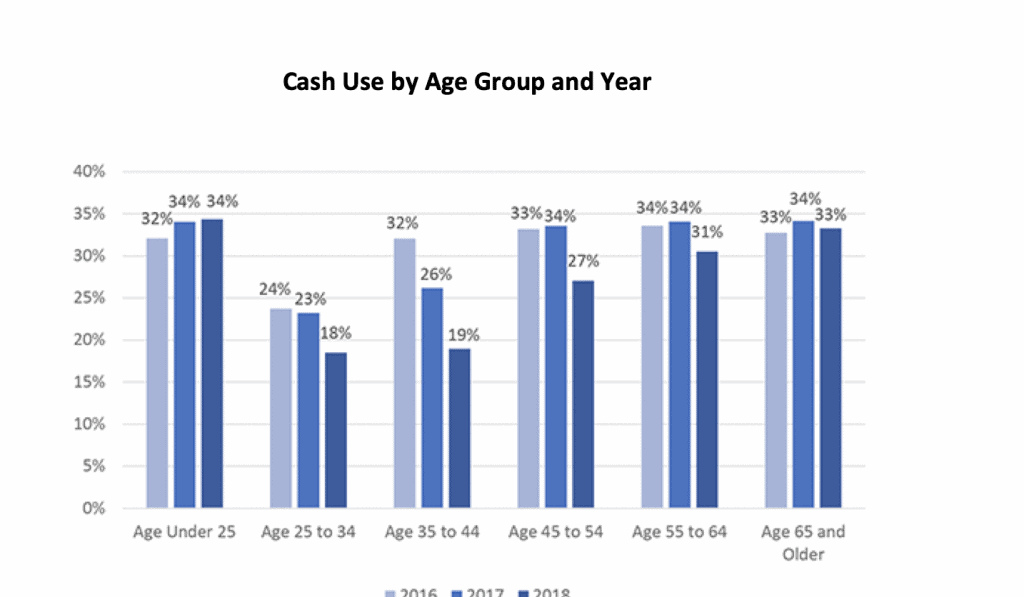
Perhaps not surprisingly, the use of cash tends to be higher among those older than 45, who came of age before debit cards were used interchangeably. Use is also high among individuals ages 18-25. Even among the former group, cash use has declined approximately three points, from 33 percent in 2017 to 30 percent in 2018.
The largest drop came from the 45 to 55 age group, for which cash use dropped seven percent over the course of a year. A portion of this decrease was the result of increased total payments from 2017 to 2018, but the decrease in cash for this age group was partly offset by an increase in the share of debit card usage by five points, while credit card usage remained consistent.
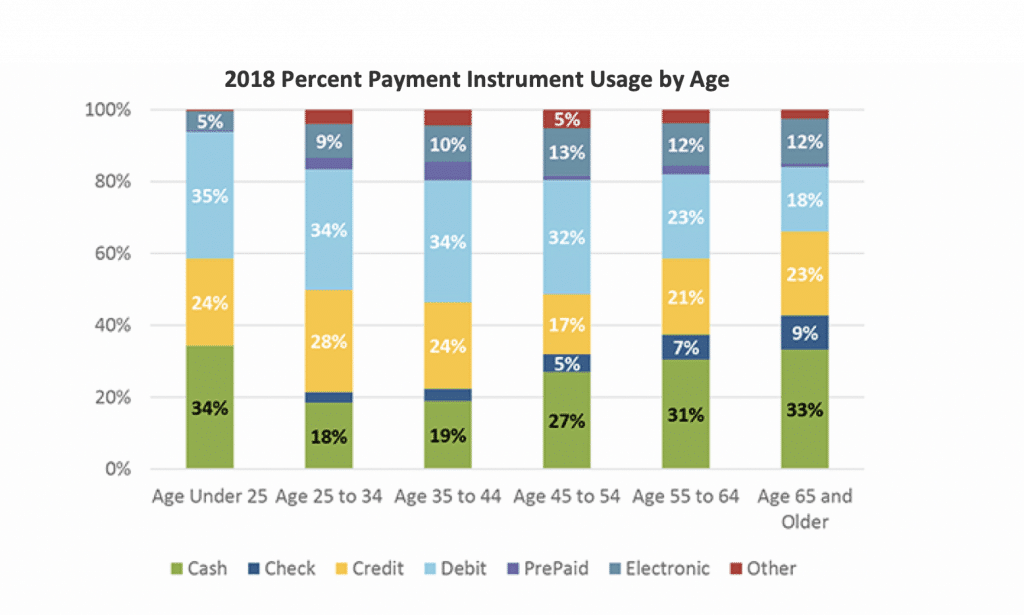
Ages 25 to 44 continue to have the lowest cash use. Specifically, the 35 to 44 age group has shown large declines in cash usage over the years, declining 13 points since 2016. This age cohort seems to have replaced cash usage primarily with an increase in debit card usage, with credit also contributing. The two tables that follow breaks out percentages of use of financial instruments by age and cash use by age and year.
2018 Percent Payment Instrument Usage by Age
Cash Use by Age Group and Year
In the final installment of our examination of the Fed’s cash study, we will explore cash usage by demographic cohort and payment use by transaction characteristic and merchant type.