Companies of all sizes now have access to a wide assortment of data-driven technologies, all of which provide more insights on both customers and competitors than ever before. As a result, there is almost a limitless amount of data available at the click of a mouse. But the challenge for most businesses is to gather, process, and utilize this data so that all stakeholders can understand.
The practice of business intelligence (BI) has evolved to meet the data interpretation and reporting demands of today’s businesses. Driven, mainly by the rapid growth of artificial intelligence and machine learning, BI capabilities, either through internal teams or outsourcing, have become a mainstay of modern business.
In today’s post, we’ll define BI and take a look at how companies use it as a strategic asset.
BUSINESS INTELLIGENCE DEFINED
There are countless definitions for business intelligence. However, we felt this definition from CIO.com did the most thorough job of defining BI:
“Business intelligence leverages software and services to transform data into actionable insights that inform an organization’s strategic and tactical business decisions. BI tools access and analyze data sets and present analytical findings in reports, summaries, dashboards, graphs, charts, and maps to provide users with detailed intelligence about the state of the business.”
Or, in the parlance of creative writing: SHOW, DON’T TELL!
THE BENEFITS OF BUSINESS INTELLIGENCE
There are numerous benefits ascribed to adopting effective business intelligence practices. However, we narrowed those benefits down to a few essentials:
- Improve the decision-making process: BI helps companies organize, analyze, and structure data sets to allow stakeholders to make more precise, more effective decisions about where the business is and where it needs to go.
- Improve customer service: Customers today expect and demand an exceptional, if not flawless, service experience. A BI team can work with collected data to anticipate and create strategies for addressing the needs and desires of existing customers.
- Enhance customer knowledge: Tools such as CRM (Customer Relationship Management) applications help business users understand how to respond to customers in real-time.
- Drive better productivity: Business intelligence helps business owners create enhanced systems that help with a variety of processes, such as: Identifying and fixing operational bottlenecks, refining all business processes, automating company-wide activities and task/time management, and organizing teams, especially cross-functional teams
- Maximize return on investment: CEOs are ultimately measured on their ability to maximize return on investment. To that end, a strong BI team helps management continuously improve things like sales efficiency, customer conversion trends, and customer retention, to name a few.
DASHBOARDS
In the broadest terms, dashboards have become the gold standard for effective BI reporting. Simply put, dashboards are automated software applications that pull together data into charts and graphs that create a sense of the immediate state of the company. But dashboards are also valuable in looking back at trends that may provide learning for future strategies.
The Recovery Decision Science Business Intelligence team develops thousands of dashboards for its clients and internal teams. The team also looks at trends in the broader economy. For example, at the outset of the pandemic, our BI team began to track the impact that COVID-19 had on the U.S. workforce. The screenshot below provides an overview of our Unemployment dashboard in Tableau public.
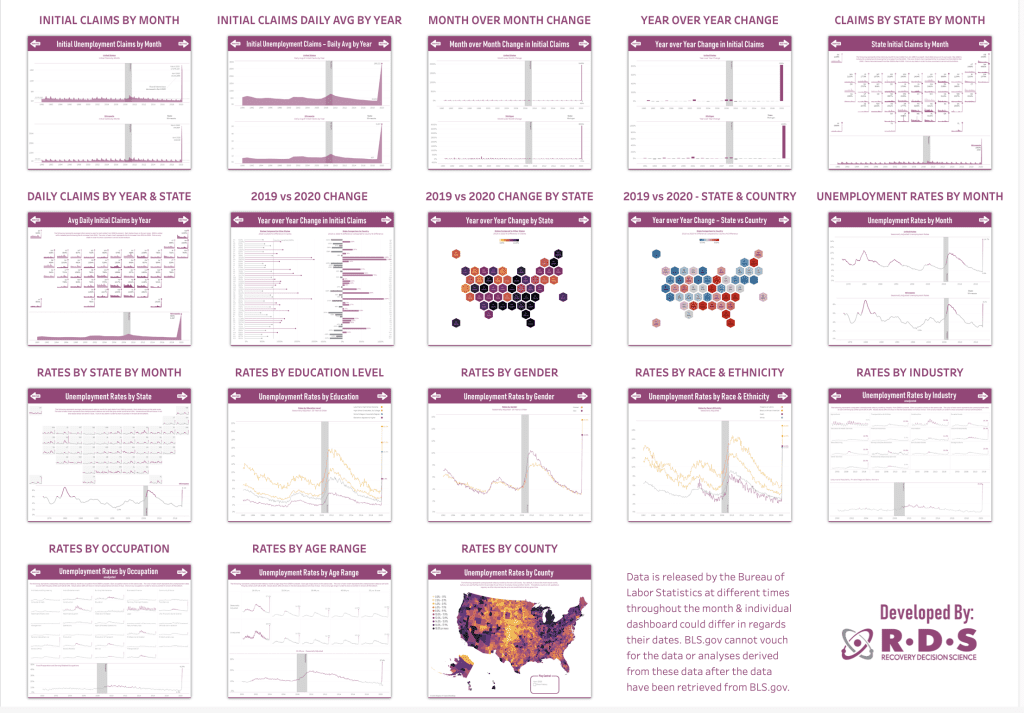
Updated every month, these 18 INTERACTIVE DASHBOARDS help tell the U.S. unemployment story from several perspectives:
- There is a national look at initial claims, plus unemployment rates by demographic groups, industries, occupation, age range, ethnicity, and education level.
- National and state-by-state unemployment trends.
- County-level breakdowns.
In addition to the Unemployment dashboards on the RDS Tableau Public page, you’ll find dashboards covering:
- U.S. home sales
- Mortgage rate trends dating back 50 years
- Purchase and refinance mortgage application trends
- Consumer complaints filed with the CFPB
- Consumer loan charge-off rates
- U.S. debt analysis
- The rise in college pricing
- Changing balance sheets across the generations
CLICK HERE to view all of the interactive dashboards on the RDS Tableau Public page.
To learn more about Recovery Decision Science’s Business Intelligence Team, contact:
Kacey Rask : Vice-President, Portfolio Servicing
[email protected] / 513.489.8877, ext. 261