Last year, the New York Federal Reserve Bank’s Consumer Credit Panel published a report on debt held by age groups, with a particular focus on comparing trends at the far ends of the age scale. The report covered debt and credit trends over a 12-year period: 2003-2015.
What the panel found was that aggregate debt balances by younger borrowers have declined modestly during this period. The debt profile reallocations saw a shift from credit card, auto and mortgage debt toward student loan debt. We commented on this in a previous post: In Our Parent’s Basement: Student Debt and Home Ownership.
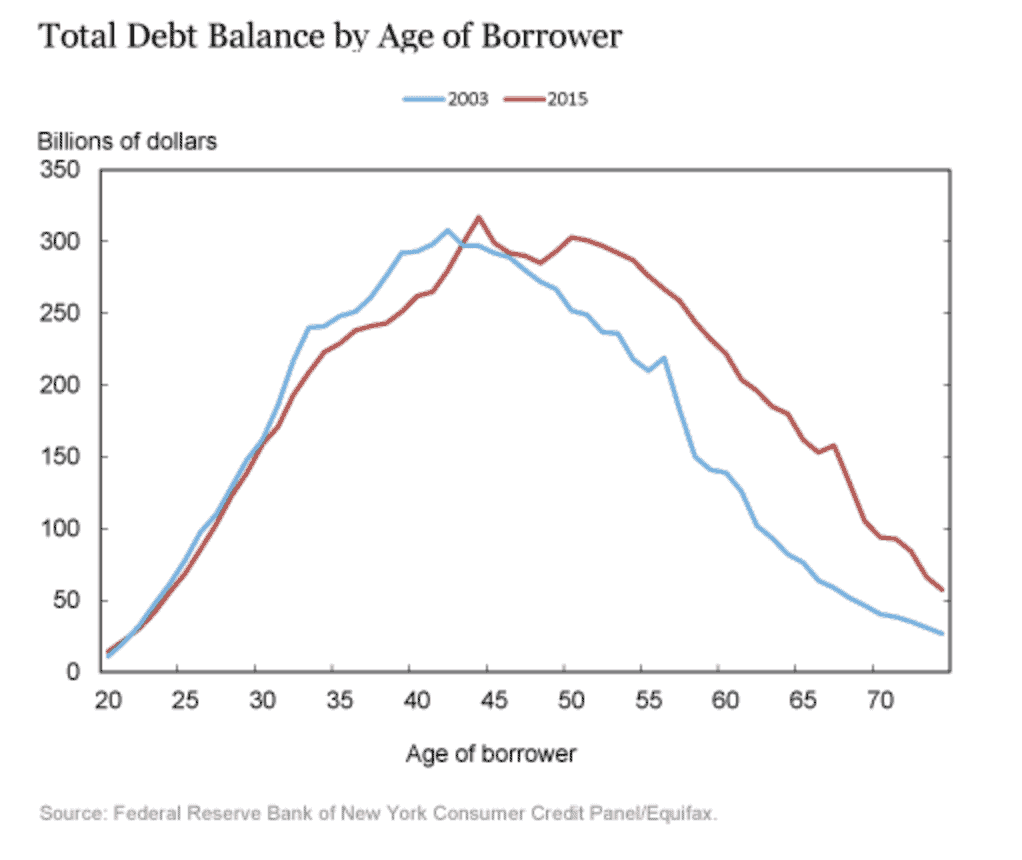
Conversely, debt among borrowers between the ages of 50 and 80 has increased by nearly 60% over the same period. This is captured in the table below which illustrates U.S. aggregate debt balances by the age of borrower for the 12-year span:
In explaining this significant debt shift to older borrowers, the Fed suggests a combination of two factors. First, and most obvious, we have an increasingly aging population. Secondly, there has been an overall change in the amount of debt per borrower that Americans choose to hold at each individual age.
The following table shows the change in aggregate debt held by individuals of each age from 2003 to 2015 as a share of their 2003 debt.
- The BLUE section of each bar represents the change in aggregate debt at each age that would be predicted based on the change in Americans’ age distribution from 2003 to 2015 alone if each group held the same debt per borrower in 2015 that it held in 2003.
- The GOLD segment of each bar shows the change in debt at each age group that is attributable to changes in the amount of debt per borrower for each age group.
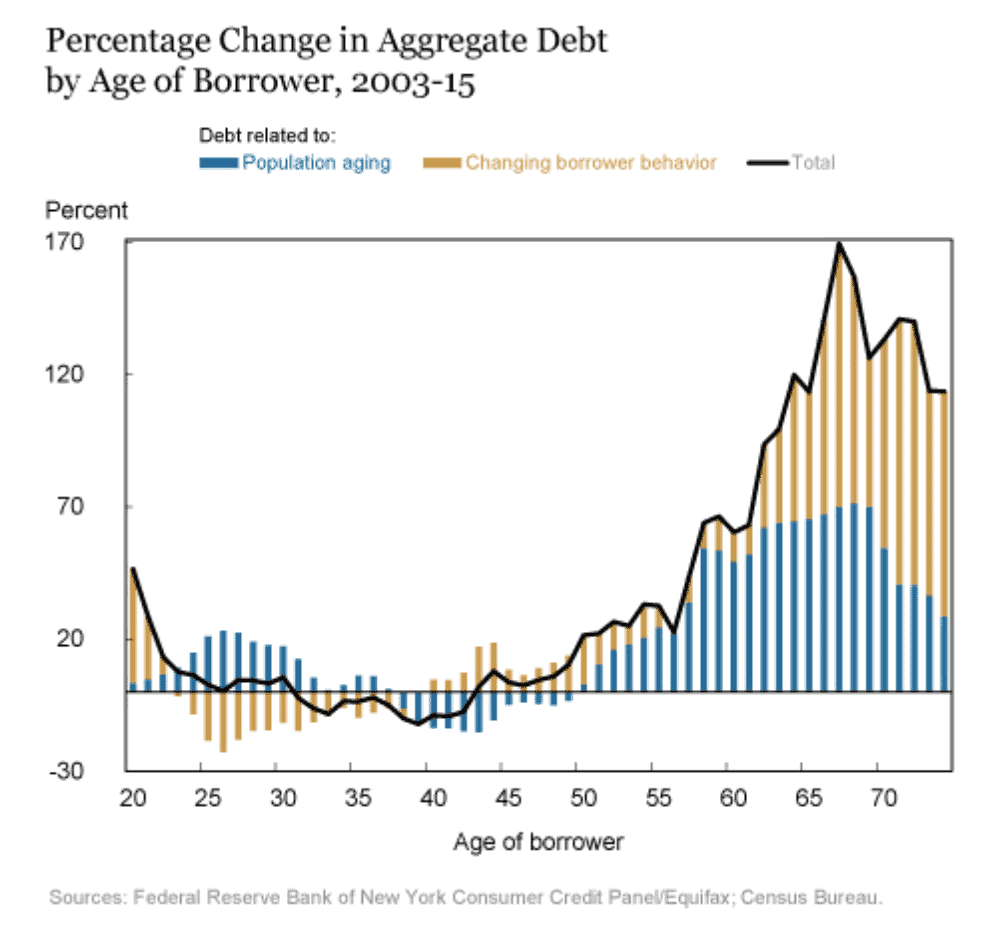
This is an interesting analysis. As you can see, the population of both millennials and older individuals is increasing, the latter at a much more significant rate. To that end, we would expect to see higher aggregate debt balances at both ends of the age spectrum. However, we’re only seeing increased debt balances among older borrowers –instead of their younger counterparts. Much of this differential is driven by the fact that millennials are putting off major purchases, such as homes and new cars, until later years.
Let’s look at the debt story from another angle. The following charts show average debt per U.S. resident by age in 2003 and 2015. The charts break out the age profiles of borrowers for the five most common loan types: mortgages, auto loans, credit cards, student loans and home equity lines of credit (HELOCs).
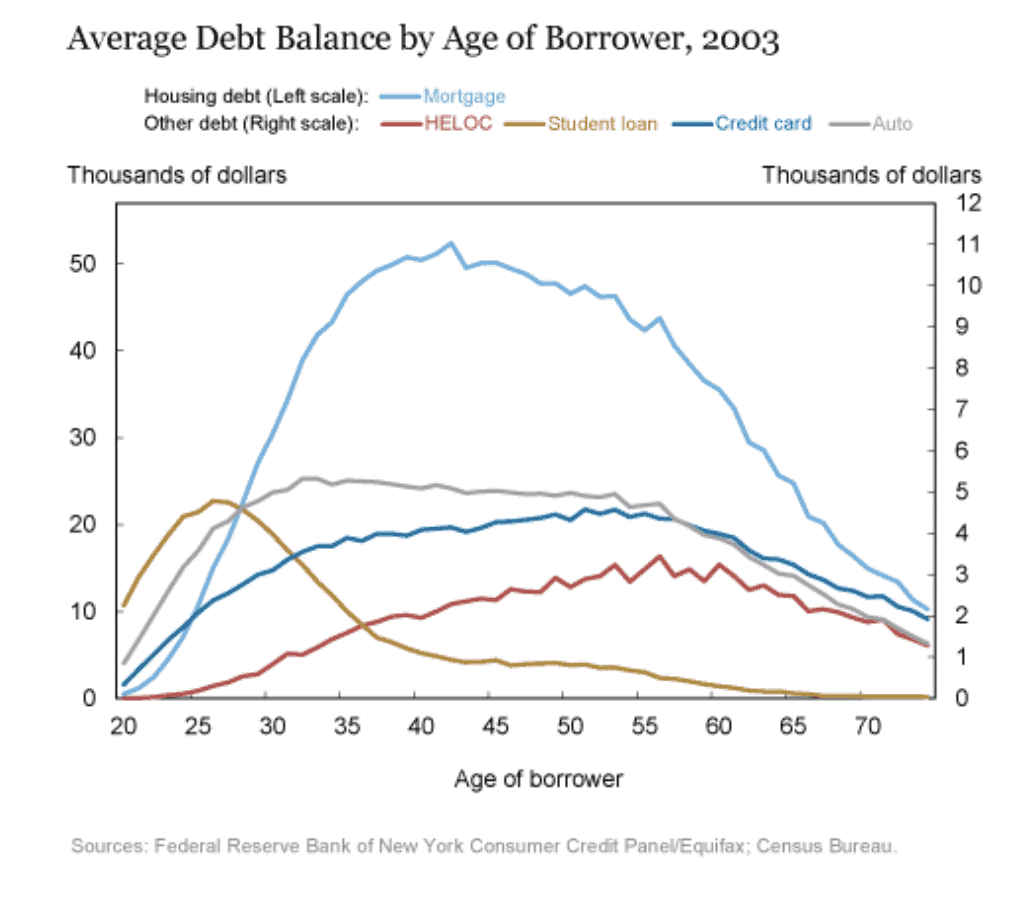
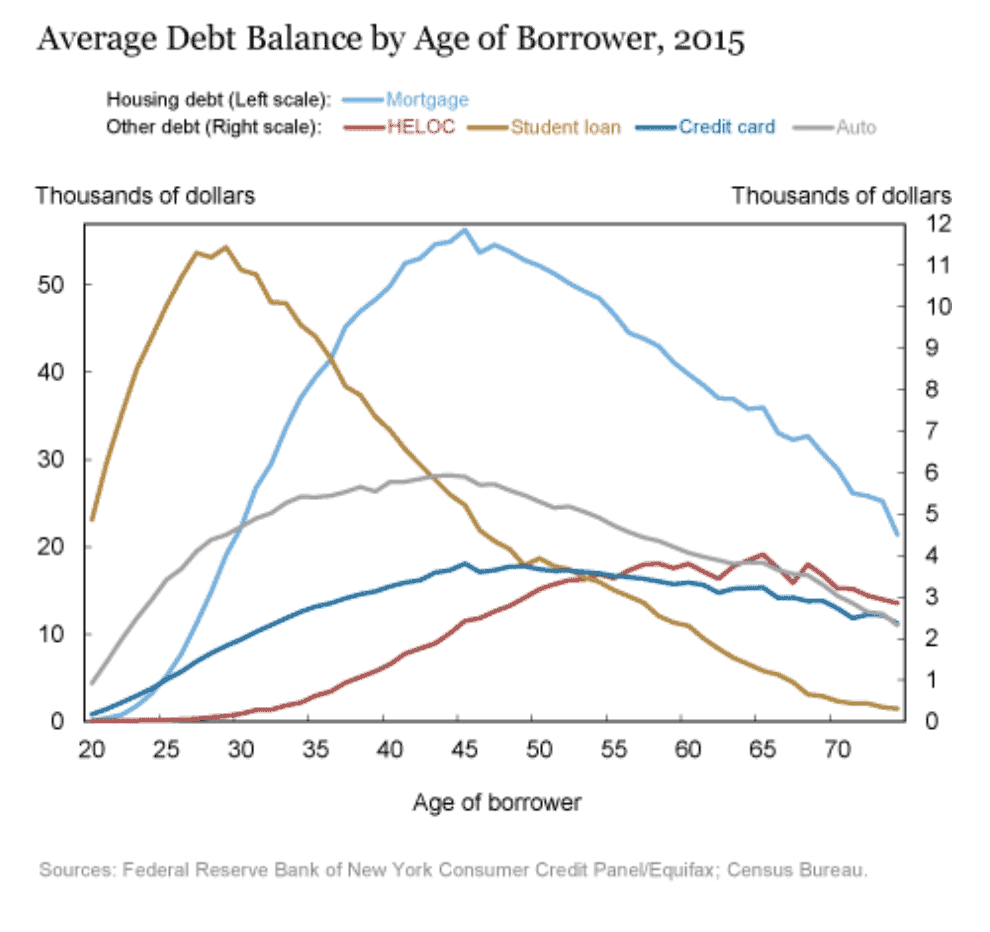
These charts reveal some noteworthy trends:
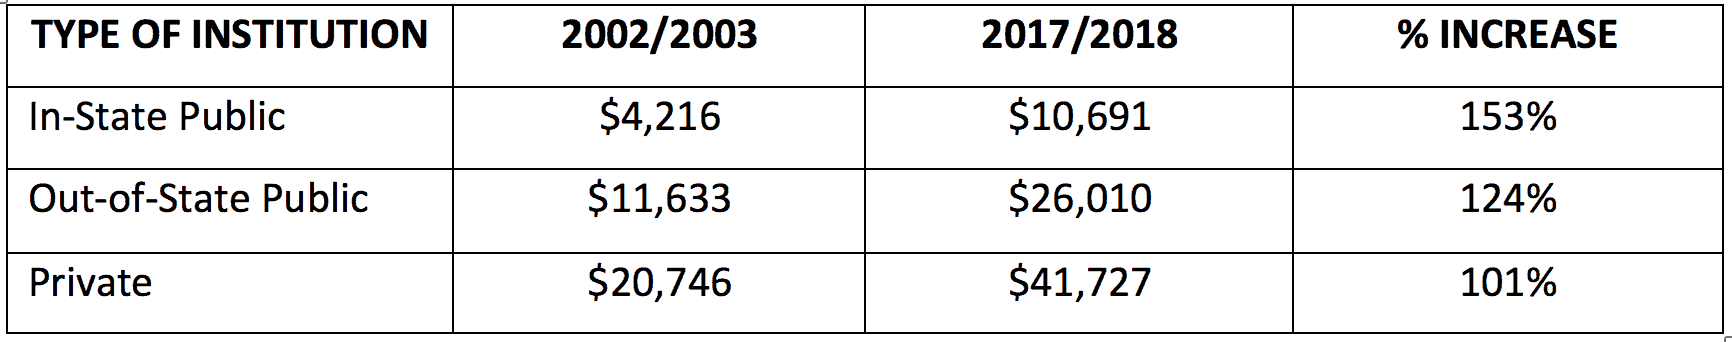
First, at each age, the average student loan balance per borrower more than doubles. This change, of course, is driven by dramatic and unprecedented increases in college tuition across the board. In September, 2017, U.S. News and World Reports published a report entitled “20 Years of Tuition Growth at National Universities”. For the purpose of consistency in this post, we’ve used annual, average tuition data for the periods 2002/2003 and 2017/2018 to illustrate the increases:
The second noteworthy trend is that the age distribution of each debt type shifts to the right, or to the older age segments.
Younger borrowers maintain lower balances in every category expect student loans. By comparison, older borrowers hold higher per capita balances in every category except credit card debt.
Why such a dramatic shift in debt to older borrowers? The Fed suggests several dynamics at play:
- The credit boom preceding the Great Recession built higher consumer debt levels
- After the crash, underwriting standards tightened, minimizing the opportunities for new borrowers to get new loans. This across-the-board tightening would lead loans and their associated borrowers to be older, on average, in 2015 than 2003.
- The shift toward older borrowers could have also resulted from new loan originations favoring older, more stable borrowers over younger borrowers.
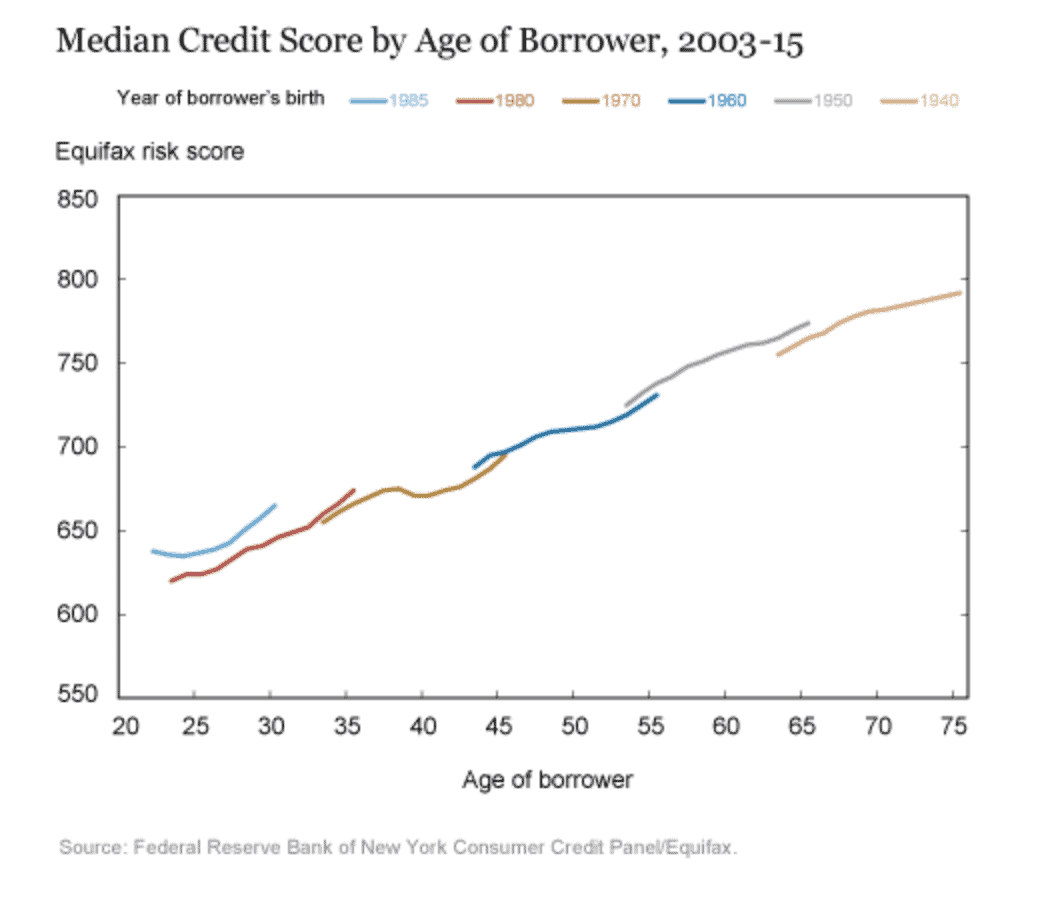
There is little surprise in the fact that higher risk scores in underwriting affect younger borrowers differently than older borrowers. Today, this situation is exacerbated by ballooning student loan debt which effects younger adults’ ability to take out new mortgages and auto loans.
Of course, there is an underlying story here that has not changed much over the years: older borrowers have a comparatively stable income stream and also greater experience with managing credit. This results in credit histories that are stronger for older adults compared to younger adults.
So, in sum, the Fed report suggests that the aging of American borrowers bodes well for the stability of outstanding consumer loans. This should lead to reductions in credit-fueled consumption growth and greater balance sheet stability.
SOURCES:
http://libertystreeteconomics.newyorkfed.org/2016/02/the-graying-of-american-debt.html