To assess the impact COVID-19 has had on the U.S. real estate market, the RDS data visualization team did a deep dive on seasonally-adjusted homes sale, by month, from 2000 through May, 2020.
For perspective, spring is traditionally considered the best time of year to sell a home. In fact, according to Zillow, homes sold in the first two weeks of May sell six days faster and for $1,600 more than the average listing.
Of course, a pandemic can wreak havoc on attempts to project business results, regardless of the industry. But real estate is particularly vulnerable to economic chaos because buying or selling a home is one of the most important financial decisions a person can make. Homeowners who may have been motivated to sell in February, might have pulled back because of fears over career and income disruption. Many people were also reluctant to have strangers strolling through their homes during an open house. H
While these factors combined to have a chilling effect on spring real estate activity, there was a flip side. Mortgage rates recently hit a 50-year low at 3.1% for a 30-year fixed. Plus, savvy real estate agents began to employ new technology (Zoom, virtual reality, etc.) to handle everything from open houses to closings.
Below is a screen shot from the RDS U.S. Real Estate Tableau Workbook. A few salient points:
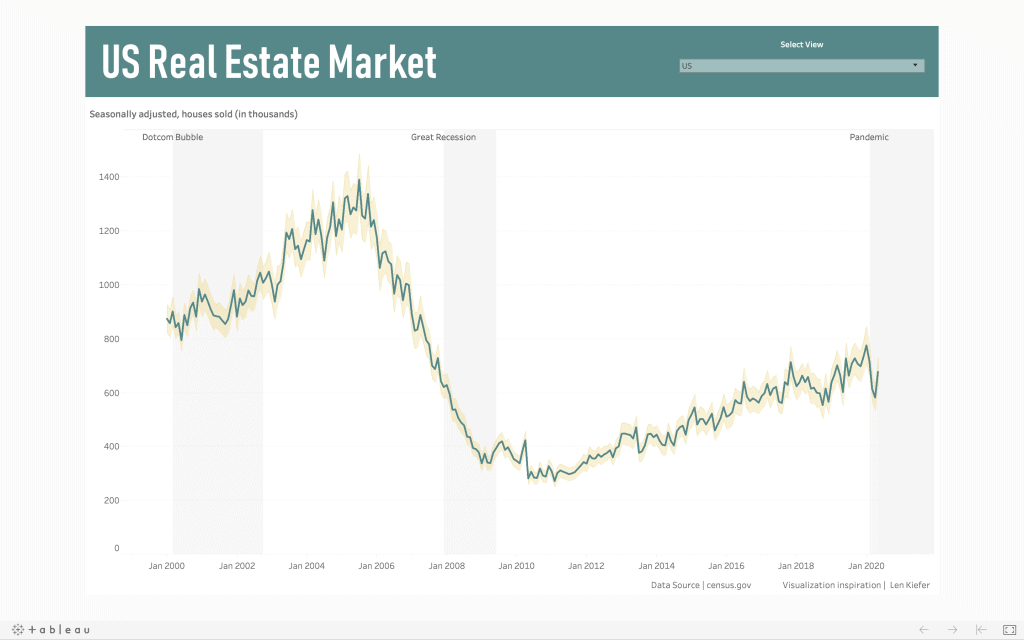
- The year got off to a strong start with 774,000 seasonally-adjusted home sales in January. This was the highest January total since 891,000 homes were sold in January, 2007.
- Home sales dropped 20% by the end of March, to 612,000. March sales on a year-to-year basis were down 12%.
- Seasonally-adjusted home sales continued to fall in April, down to 580,000. On a year-to-year basis, April home sales are down 13.7% versus the 2019 total of 664,000.
- May home sales jumped nearly 17% over April, coming in at 676,000, which was 12.7% over the same month a year ago. It’s likely that the May spike corresponds to the continued drop in 30 year fixed mortgage rates, now at 3.1%. See our RECENT POST for details.
- For perspective, here are the high and low water marks in home sales over the past 20 years:
- July 2005: 1,389,000
- February 2011: 270,000
To experience the interactive home sales viz, CLICK HERE.
On a related, and positive, note, after hitting a 4 1/2 year low in April, mortgage applications have been consistently rising through May and June.
The Mortgage Banker’s Association Purchase Index is a weekly report of mortgage loan applications based on a sample of 75% of U.S. mortgage activity. Analysts consider the Index Report a leading indicator of housing market activity. See the screenshot below, mapping the Purchase Index dating back to 1990.
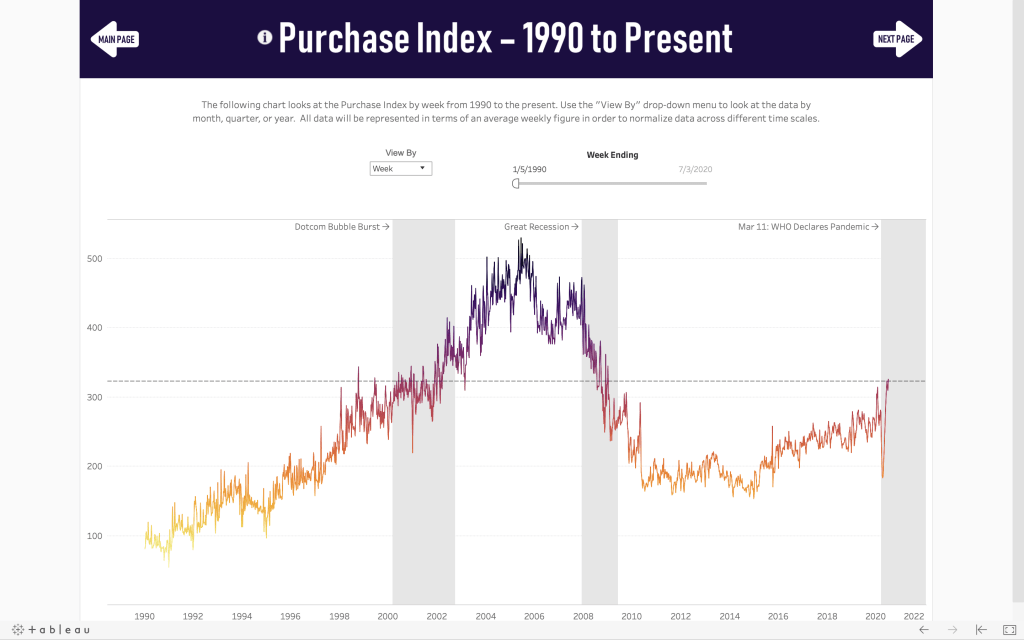
Again, you can see the decline in the Purchase Index starting in February. However, as of July 3, the Purchase Index stands at 325.5, the highest level in nearly 12 years.
CLICK HERE to see our analysis of the mortgage application market.
SOURCES