Black households in the United States have, on average, considerably less wealth than white households. In 2016, the average wealth of households with a head identifying as black was $140,000, while the corresponding level for white-headed households was $901,000, nearly 6.5 times greater. That blacks, on average, have considerably less wealth than whites strongly suggests inequality of opportunity. The economic opportunities provided by wealth range from insuring against disruptions such as surprise medical expenditures or unemployment spells to enabling access to housing, good public schools, and post-secondary education.
Economists have long studied which factors contribute to the racial wealth gap and by how much. The Federal Reserve Bank of Kansas City recently presented research showing the gap is primarily the result of a sizeable and persistent income gap.
To know why this proves true, the Fed first looked at racial history in the U.S The current racial wealth gap is the consequence of many decades of racial inequality that imposed barriers to wealth accumulation either through explicit prohibition during slavery or unequal treatment after emancipation. Examples of post-emancipation barriers include legally mandated segregation in schools and housing, discrimination in the labor market, and redlining, which reduced access to capital in black neighborhoods.
While the existence of a racial wealth gap may not be surprising, it is surprising how little the racial wealth gap has changed over the past half century, even after the passage of civil rights legislation. In fact, the 2016 wealth gap is roughly the same as it was in 1962, two years before the passage of the Civil Rights Act of 1964, according to data from the Survey of Consumer Finances (SCF).
Average white wealth in 19622 was seven times that of average black wealth. The persistence of the racial wealth gap can be seen in Figure 1, below, which plots the distributions of wealth in 2016 dollars for black and white households in the years 1962 and 2016.
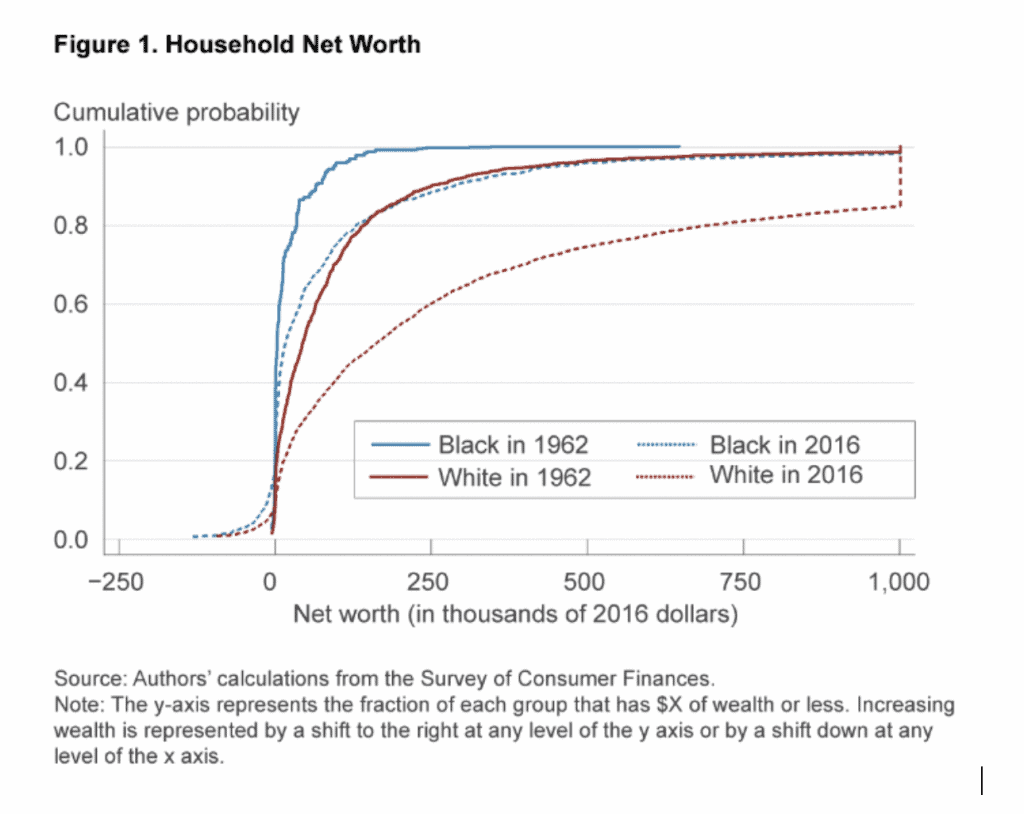
While there has been growth in wealth over time for both groups, as evidenced by the rightward shift between the solid and dashed lines, notice that the dashed line corresponding to black households in 2016 is still to the left of the solid line for white households in 1962. Simply put, over the past 50 years, the distribution of black wealth has not even caught up to the distribution of white wealth in 1962.
Some of the similarity in wealth ratios between 1962 and 2016 relates to timing. The Great Recession had a larger impact on average black wealth than on white wealth. Figure 2, shown below, plots black wealth as a fraction of white wealth for different years. There is a noticeable drop in the ratio after 2007, a dip that has not fully been undone even 10 years later.
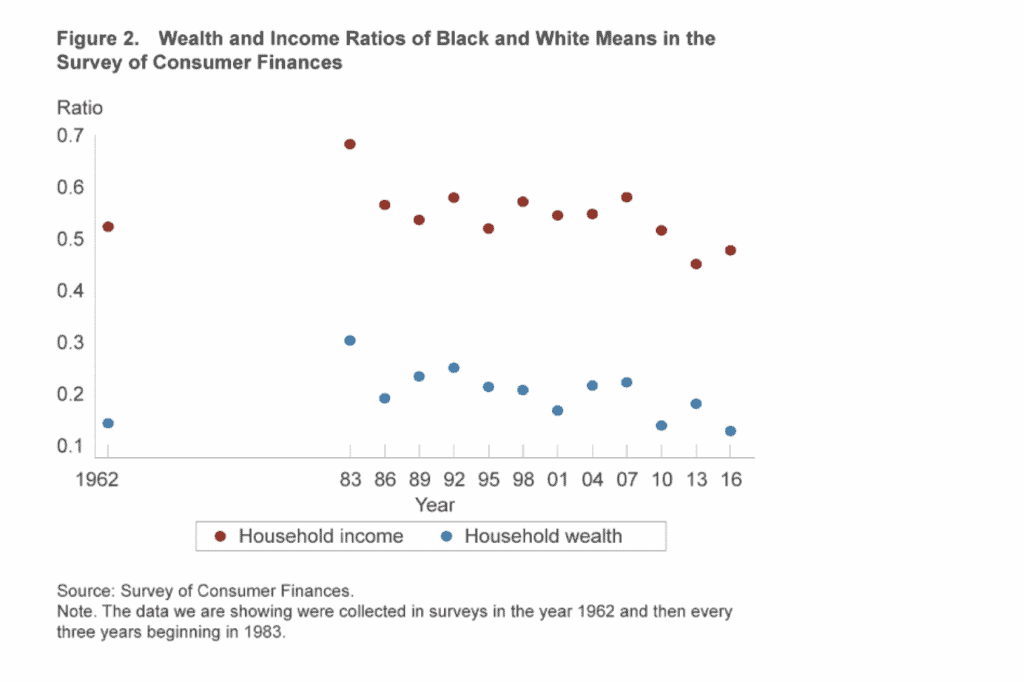
However, the wealth gap is far from closing even if we focus only on the years leading up to the Great Recession: The wealth ratio rose only from 14 percent to 22 percent between 1962 and 2007.
In our next post, we will examine the causes for this persistent difference, including differences in labor income and rates of return on investments.
SOURCE