It has been said that math is the language of the universe. Or, that the universe talks to us through numbers! Either way, before understanding any language we should first learn the basics and rules in that language.
This is the third post in a five-part series on How to Measure Success. In previous posts, we discussed the importance of Measuring The Right Thing and Picking The Right Tools to support the measurement process.
Relative vs. absolute numbers
Like any language that defines words and concepts relative to the other words and concepts, the language of the universe is relative too. Basically, relativity brings more information than absolute cases. Think about the number two. Well, “two apples” has more information than just “2”! Also, “two apples today and one apple yesterday” has more information than just “two,” or “two apples today.” Using the correct level of relativity based on problems we are working with is essential to measuring success. A simple example of that is using rates rather than absolute numbers. For instance, if you are looking at the results of your marketing campaign by state in the U.S., it is best to use rates of successful hits rather than absolute number of hits. If your campaign was homogenously implemented across the U.S., we’d expect the absolute number of successful hits to be higher in densely populated states versus the others. However, that does not really point you to the states with the best campaign outcome. In order to measure that, you need to divide your successful hits in each state by the population of that state (more correctly, campaign target population in that state). That measure represents the relative performance of your campaign by state more accurately than the case of using absolute numbers.
Cause and effect analysis vs. just numbers and stats
The field of statistics was initially developed to help us understand and explain physical phenomena around us. For instance, at some point in the past, scientists dropped a ball 100 times off a roof of a building and measured the time of the free falls before impact. Then, using the stats (times) they measured and the constant height of the building they could estimate the gravity force, g. Long before that, Newton had discovered that Earth has a gravitational force after the apple struck his head! Scientists only have to model the problem based on Newton’s finding and estimate the gravitational force in that model by using the stats they measured. Unfortunately, because of data mining techniques and faster computing time, this process is not exactly happening today. The speed of computers to compute and find correlations between variables has lured us away from the physical relations behind a process, or in other words cause and effect analysis. As an example, you might find a correlation between the number of bathrooms in a property and whether that property was foreclosed or not. But, in fact, the number of bathrooms has nothing to do with the foreclosure outcome. In case you want to see more examples of spurious correlations, the following website has a good set of examples: http://www.tylervigen.com/.
Accuracy vs. precision
If you believe that a picture is worth a thousand words, then look at the graph below, which depicts the difference between accuracy and precision.
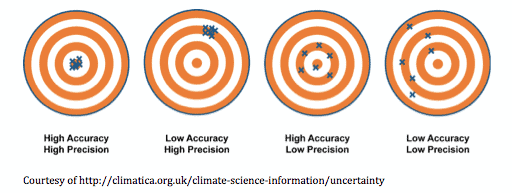
Any statistical analysis tries to estimate a parameter. Two attributes of our estimates are accuracy and precision. When the average value of our estimates is landing around the TRUE value of the parameter (bull’s eye), we can say that we have an accurate estimate. On the other hand, precision tells us how dispersed our estimates are from each other. Obviously, a model with low accuracy and low precision is not reliable at all. On the other end of the extreme, a model with high accuracy and high precision is what we are all looking for. But, how about the cases in the middle? Well, a model with high accuracy and low precision is not robust as it only could give you reliable information about the mean (average value) of the parameter of the interest. However, on the other hand, the low accuracy and high precision model is much better. It is just biased (i.e. the mean of the estimates is systematically different from the TRUE value of the parameter). Once the bias is discovered, you can correct your model by incorporating the bias and basically convert your model to a high accuracy and high precision model.
Precision basically shows how specific your estimates are. Looking at the area covered by the hits on the target boards in the left two pictures, we can see the X’s are more specific than those in the right two pictures. The lack of attention to specificity of your model is easier to identify when we try to model categorical variables.
For instance, imagine that we have a binary outcome variable like consumers defaulting on loans. Let’s say you own a company that offers loans to consumers. You can borrow money at a 4% interest rate, and can loan it out at a 7% interest rate. Let’s also assume that in any random population, 5% of people will default on their loans. Now let’s consider two models we might use in deciding whether to offer loans:
- Model 1: Pull a credit bureau report, and assume everyone whose FICO score is below 600 is likely to default
- Model 2: Assume everyone will pay back his or her loan
Model 1 will not perfectly predict which consumers will default. Let’s say it is only 80% accurate – it finds 80% of the defaulters, and lets 20% of defaulters through. Your company will net 3% in interest, and lose 1% to defaults, leaving you with a 2% profit margin.
Model 2 assumes everyone will pay back the loan. Since we know the default rate is 5%, this model is 95% accurate! But your company nets 3% in interest, and will lose 5% to defaults, leaving you under water by 2%.
In this case, Model 2 is much more accurate, but it’s not solving your problem. Model 1 may be less accurate, but it’s much more useful once you run the cost and benefit analysis. So the moral of the story is: do not let 95% accurate models fool you!
NEXT WEEK’S POST: SEEK HARMONY AMONG THE MEASUREMENTS