As we wrap up our series on Financial Invisibles, we’ll revisit the study undertaken by Unifund and PYMNTS.com about six months after the original Quarter Three 2017 questionnaire. We’ll examine how financial situations changed and what was responsible for the evolution.
To quickly recap, Unifund and PYMNTS.org undertook a study of those people who don’t participate in traditional financial or banking systems, termed them ‘Financial Invisibles,’ and divided them into four categories: No Worries, Second Chances, On the Edge, and Shut Outs.
No Worries are able to participate through traditional financial tools but choose not to; Second Chances have incurred some delinquencies in bill payment but are still able to participate; those who comprise On the Edge have no delinquencies but struggle to make ends meet and to fully participate; and Shut Outs have had so many financial delinquencies participation in traditional banking and payment systems aren’t an option.
The chief finding from the census-balanced survey of more than 2,000 consumers was that the majority felt their overall financial situations has improved since the baseline study. But, oddly, one-third of respondents said they fell behind on payments in the last year and the number of respondents with payment problems increased from 31 percent in Q3 2017 to 33.2 percent in Q1 2018. (See figures below.)
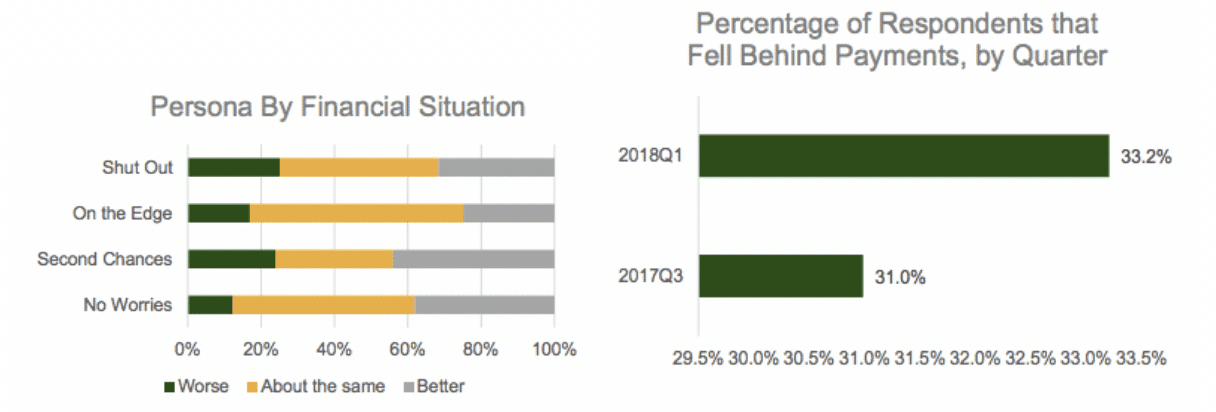
Only 17 percent of survey respondents in Q1 reported their financial situations had worsened in the previous six months. In Q3, 25 percent said it was better than it was in the prior year (2016) but by Q! 2017, 38 percent reported improvement.
This improvement may be attributed to our pulling from a different, although census comparable, sample: In our latter survey, respondents reported higher education levels than the earlier survey. It’s no secret higher education levels typically result in higher incomes. (See figure below.)

Correspondingly, more respondents to the Q1 2018 survey reported better access to the financial system, with 95 percent having checking accounts, as opposed to 86 percent in the Q3 2017 survey.
The higher education levels also resulted in a higher percentage of those holding high credit scores, with almost 60 percent of the second group posting scores of above 680 while only 41 percent did in Q3.
Other findings noted include:
- Debt loads: Educational debt fell by a stunning near-50 percent from one survey to the next.
- Bank distrust: More people in the No Worries group reported having a dislike or distrust of banks, with distrust moving 17 percent to 21 percent and dislike for banks increasing from 17 to 29 percent. Among On the Edge, distrust shot up 20 points, from 16 percent to 36 percent. Shut Outs showed an identical 20 point
- Bank fees – up in one group, down in another: Complaints about bank fees increased in the No Worries group from 17 to 29 percent but in the On the Edge group – one in which we might reasonably expect consumers to worry about costs more – the percentage complaining about bank fees decreased from 30 percent to 11 percent.
- Pay instrument usage: Use of almost every financial instrument went up, with credit card use increasing across all groups except Shut Outs from 30 to 54 percent. PayPal use climbed from 28 percent to 38. With Shut Outs, use of almost every financial product decreased in the first quarter 2018: this indicates a widening class gap those in the financial industry should keep an eye on.
- Medical bills still problematic. Another constant trend is that medical debt is still a problem for Shut Outs, although the percentage dropped from 31 to 26 percent from Q3 2017 to Q1 2018.
- Shut Outs remain in worst shape. About 27 percent of Shut Outs say their financial situations cause them great stress, no surprise given their low incomes and inability to access financial tools.
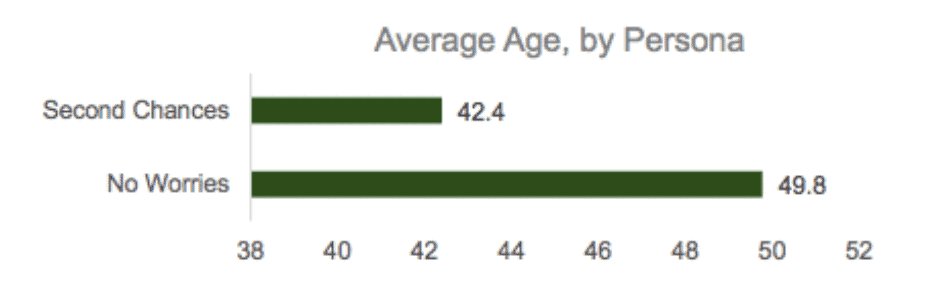
Perhaps the most interesting finding comes from examining the Second Chances group. Those in this group have similar income and education levels to No Worries but are more comparable in their financial situations to Shut Outs. Age appears to be the reason, as Second Chances are younger, struggle to pay their bills, and report low levels of saving despite high incomes. The figure below represents the age distribution.
Members of Second Chances tend to use more expensive and less common financial instruments, such as payday loans, and have less access to credit cards. Many carry student loan debt – not an uncommon burden in this era – and also have mortgages. While home ownership is a hallmark of the American Dream, a mortgage may prove to be a burden to Second Chances and account for their falling behind on bill payments. This group is most interested in financial education.
The aging Baby Boom generation may be the last American generation to retire with pensions and a fully-funded Social Security system. Based on the results of the Q3 2018 survey, we may conclude financial experts would be advised to target the Second Chances group – those in young middle age with high-income levels and high education levels – for full investment in the financial services market.
Here is a link to the complete Financial Invisibles report on PYMNTS.com