Research on consumer beliefs since the financial crisis of the aughts has focused on the potential importance of extrapolative beliefs, or the narrow assumption trends in asset prices will continue. This line of thought is frequently cited as a reason for excessively optimistic expectations about future asset prices and, thus, the bubble formation.
In this post, we look at research from the Federal Reserve Bank of New York analyzing how consequential extrapolation can be for housing prices.
The Fed used microdata from a home-price expectation survey, referring to price forecasts as ‘more optimistic’ if they are positive. The analysis was based on the housing module of the Survey of Consumer Expectations and used data from 2015-19.
Among other things, respondents were asked about their perceptions of past local home price changes, expectations for future local home price changes, past housing-related behavior, their future likelihood of buying a home or investment property, and the main reasons for their anticipated behavior.
The chart below presents a quantile-binned scatter plot of our two key variables, perceived past home price appreciation (HPA) and expected HPA. The colors reflect the respondent’s expectations of price growth over the next year – gray is the highest at 25 percent, gold next highest, then red and, finally, blue with the lowest expectations of growth over the next year.
We can see that households within different quantiles in the conditional home-price belief distribution extrapolate very differently. The bottom quantile shows almost no relationship between perceptions of last year and expectations for next year, while the top quantile extrapolates much more than the rest of the population. That is, the steep slope of the gray line indicates that the group with the most positive expectations also expects the future to be the most similar to the past.
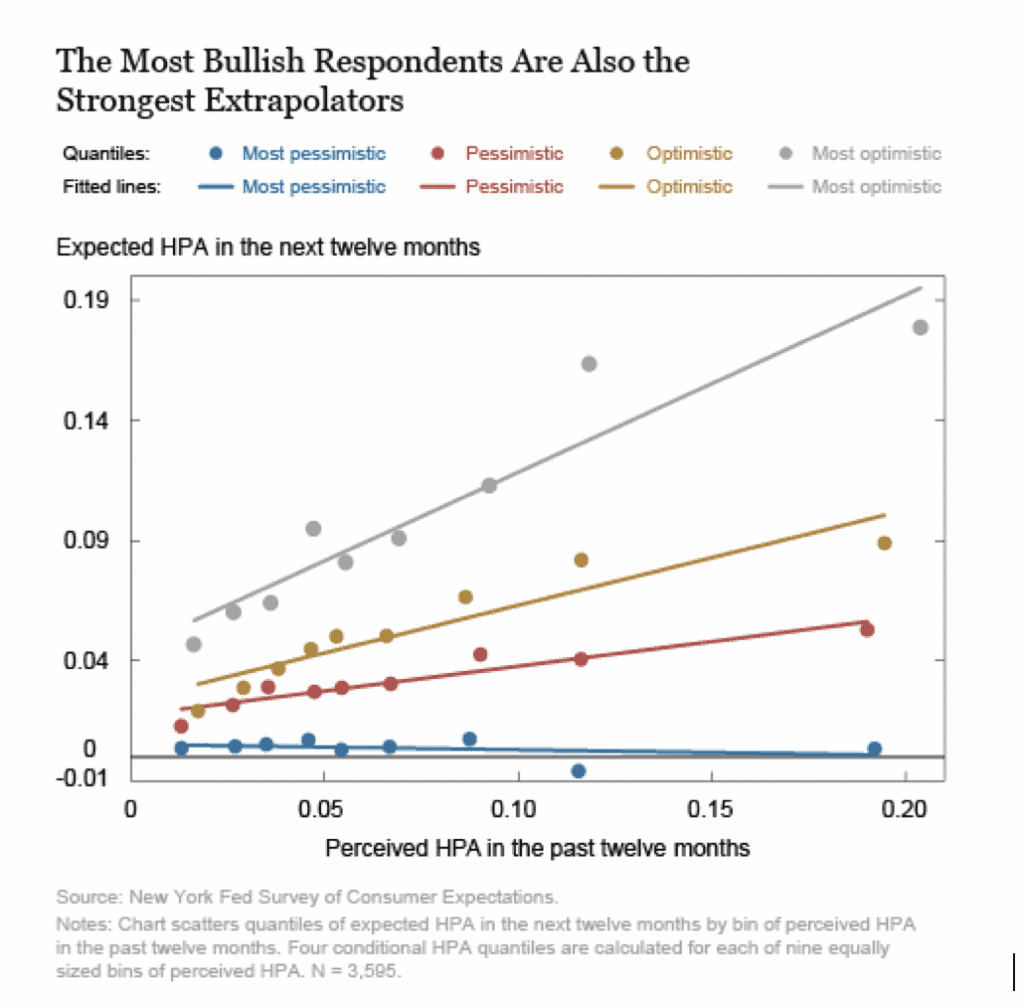
The chart doesn’t control for any factors, so it could be driven by location or personal characteristics. To formalize the observations from the chart and estimate how the degree of extrapolation varies over the conditional distribution of optimistic beliefs, the Fed estimated quantile regressions with the conditional distribution of one-year-ahead expected local HPA along the y-axis, and the perceived past local HPA along the x-axis.
The study also included demographic controls, including ethnicity, gender, marital status, education, labor force status, age, and logs of household income, home equity, and liquid savings. The extrapolation coefficient reports the degree to which a given quantile of expectations depends on an individual respondent’s reported perception of past local HPA.
The constant term reflects how optimism—higher expected appreciation not explained by any of the covariates—varies across quantiles of the conditional distribution of expectations. We call the constant term the “baseline optimism coefficient,” because it reflects expected price growth even when perceived past house price appreciation is zero.
The first preliminary finding was that there is wide dispersion in the degree of extrapolation, potentially explaining why survey evidence and models diverge. The next chart plots the slope coefficient against the constant term. A household at the 10th percentile of the conditional home-price belief distribution exhibits virtually zero extrapolation, while a household at the 90th percentile expects house prices to rise 0.67 percentage points for every one percentage point of past appreciation.
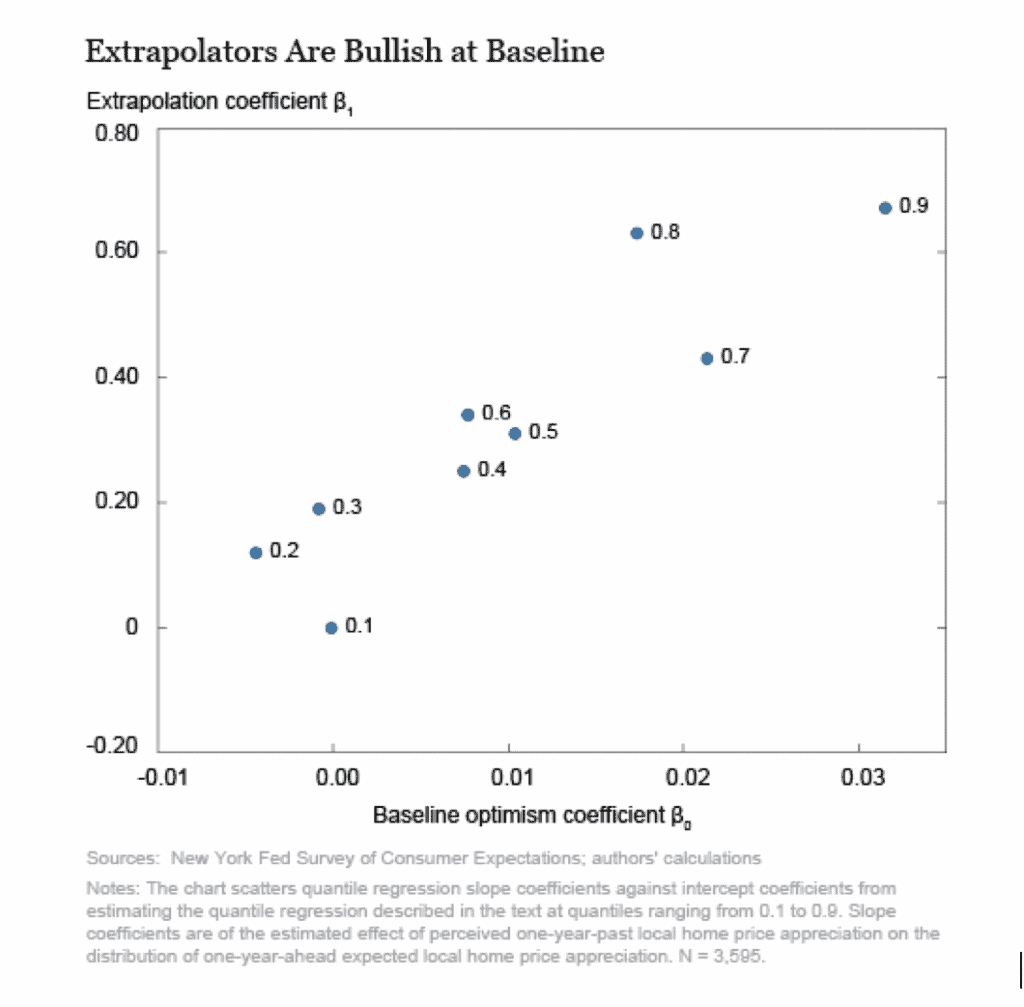
There was also significant variation in baseline optimism. Even controlling for the degree of extrapolation and individual-level controls, those respondents who are the most optimistic expect appreciation next year that is more than three percentage points higher than the appreciation anticipated by similar but pessimistic respondents. Lastly, we find that extrapolation and baseline optimism seem closely related. Extrapolation and baseline optimism move together: the strongest extrapolators are also the most bullish on local house prices even when they perceive zero past appreciation.
Thus, optimists extrapolate much more than the rest of the population-but are optimists particularly likely to be housing market participants and thereby influence price?
In the chart below, the average reported likelihood of buying next period by optimism level is plotted. The results suggest limited scope or extreme optimism to affect house prices.
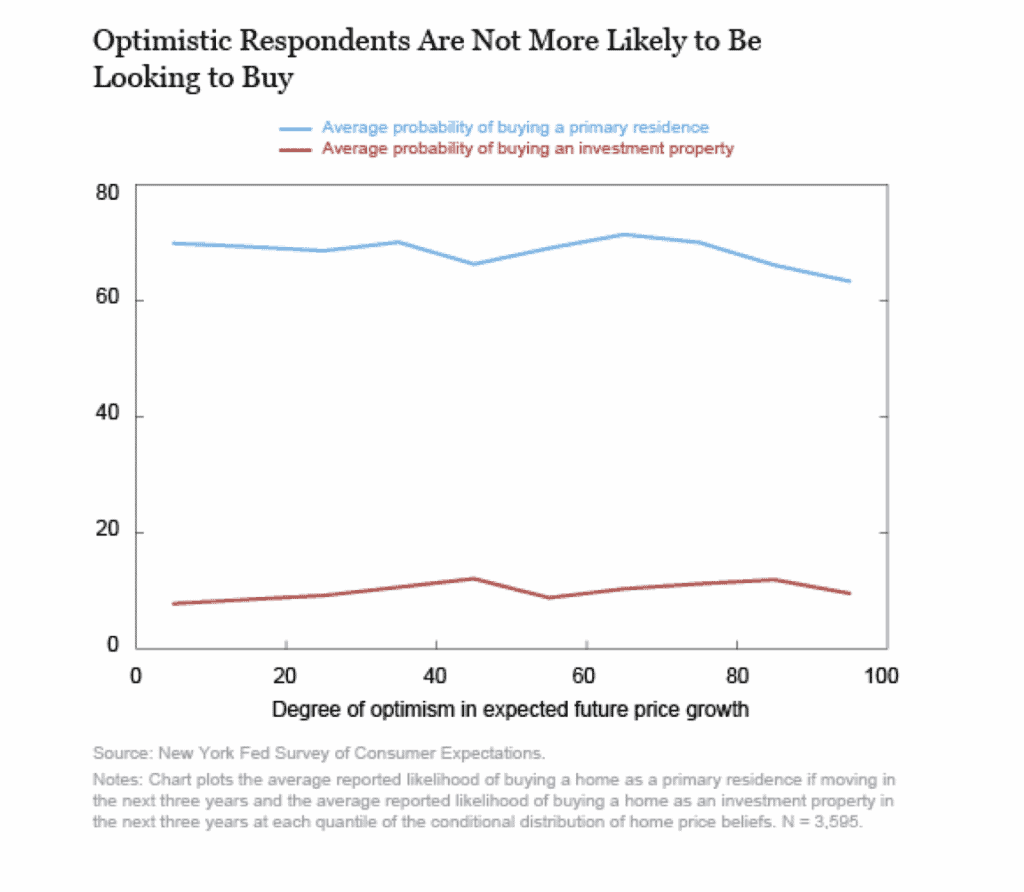
The most optimistic respondents about future prices (top percentiles) are not overrepresented among likely homebuyers (blue line) or investors (red line). Surprisingly, the most optimistic respondents did not report being more likely to buy or invest;, we find that the most optimistic respondents are also the most likely to cite down payment and income requirements as the biggest inhibitors to purchasing a home.
The Fed found optimists extrapolate twice as much as the median household. The relationship between extrapolation and aggregate prices may have been stronger historically, but of note for models of credit cycles going forward, analysis shows the most optimistic extrapolators in the study period are not more likely to enter the housing market.
This finding suggests that there may not be enough extreme extrapolators in the housing market to justify models that rely on them to move prices and trading volumes.
SOURCE