Homeownership historically has been an important means for Americans to accumulate wealth. At more than $15 trillion, housing equity accounts for 16 percent of total U.S. household wealth.
Consequently, the U.S. homeownership cycle has triggered large swings in Americans’ net worth over the past twenty-five years. The nature of those swings has varied significantly by race and ethnicity, with different demographic groups tracing distinct trajectories through the housing boom, the foreclosure crisis, and the subsequent recovery.
The Federal Reserve Bank of New York took a look into the dynamics underlying these divergences.
A look at the 2016 Survey of Consumer Finances highlights key patterns and disparities in U.S. homeownership. For the median home-owning American household, home equity is their most important asset. This is especially true for Black and Hispanic households; although they have lower rates of homeownership and lower net worth than white households overall, among households that own their primary residence, home equity is a larger part of their net worth than it is for white households that own their primary residence.
Housing wealth has, of course, fluctuated with the housing cycle. Nationally, the homeownership rate hovered around 64.3 percent between 1965 and 1994. But beginning in 1994, homeownership began rising steadily, peaking at 69.2 percent in 2004. The rate then went into decline through the Great Recession and beyond, finally recovering to just over the long-run average in 2016.
The increase in homeownership during the boom was driven by a surge of first-time buyers. And the decline in homeownership during the bust was driven primarily by a wave of foreclosures, as many of those first-time owners transitioned back to renting or “doubling up,” reducing the overall number of households.
The chart below breaks down homeownership rates down by race/ethnicity. First, as historically has been true, homeownership is much higher among white households, which had a 73.1 percent homeownership rate in the second quarter of 2019, compared to 46.6 percent for Hispanic households and 40.6 percent for Black households.
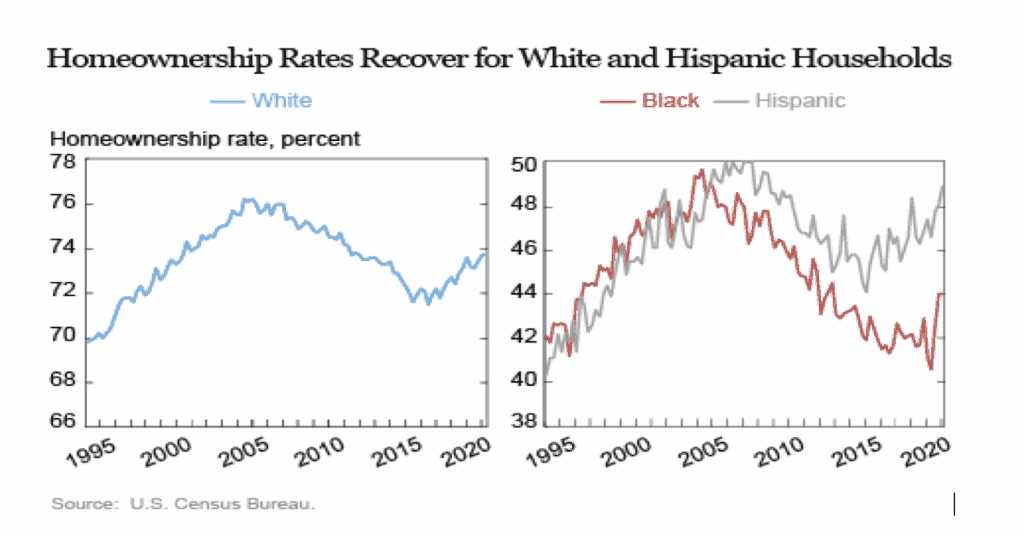
Even as large gaps persist in homeownership levels, homeownership trends have recently diverged. While white and Hispanic homeownership rates have roughly mirrored the national trend, the Black homeownership rate has experienced a much steeper and longer decline since 2004, falling to a historical low of 40.6 percent in the second quarter of 2019 before edging up in recent quarters.
As a result, the gap between white and Black homeownership has been growing. After holding relatively steady at an already large 27 percent between 1994 and 2007, the gap widened to 29 percent between 2008 and 2017 and has averaged 31 percent since 2018. In contrast, the homeownership gap between Hispanic and white households, though still wide, has contracted slightly over this period.
To explore these gaps, the Fed uses its Consumer Credit Panel (CCP), which is based on Equifax credit report data, to document the experience of individuals as they enter and exit homeownership. The Fed applies the same framework used in a post on “Racial Disparities in Student Loan Outcomes,” which uses the zip code of each borrower to derive a proxy for race (based on population estimates from the Census Bureau). In the analysis that follows, white, Black, and Hispanic areas are defined according to the majority race/ethnicity of each zip code’s residents.
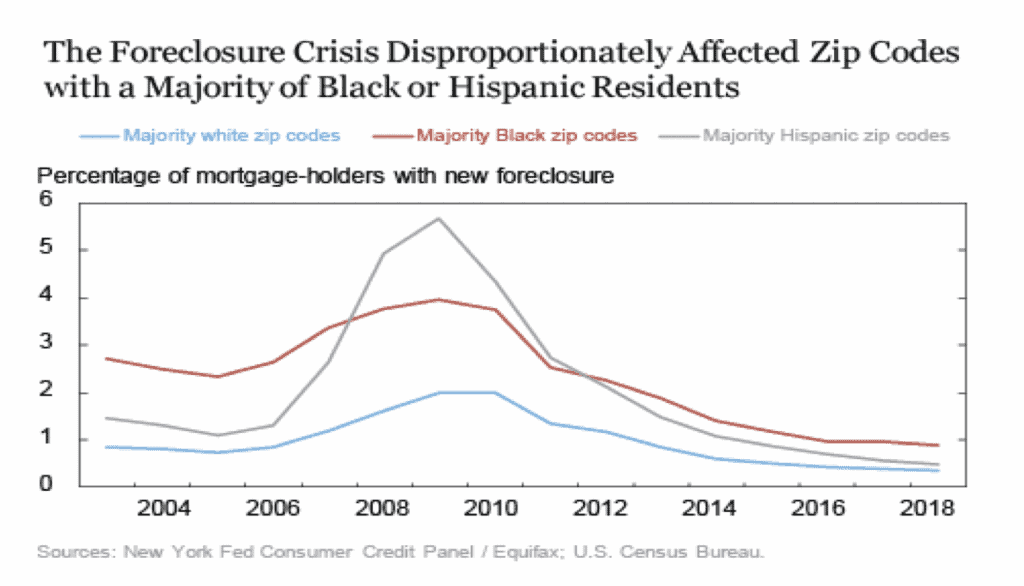
Below, we look at foreclosure rates by area. We see that the foreclosure crisis disproportionately affected zip codes where Black or Hispanic residents form a majority. The very steep increase in the foreclosure rate in Hispanic areas during the crisis reflects, in part, the concentration of majority Hispanic zip codes in such states as California and Florida—places that were affected more severely by the housing boom-bust cycle. It’s also notable that foreclosure rates in majority Black areas have remained higher than those in other areas, although foreclosure rates are low, overall, by historical standards. Thus, residents of majority Black zip codes are more likely to exit homeownership through foreclosure, even now.
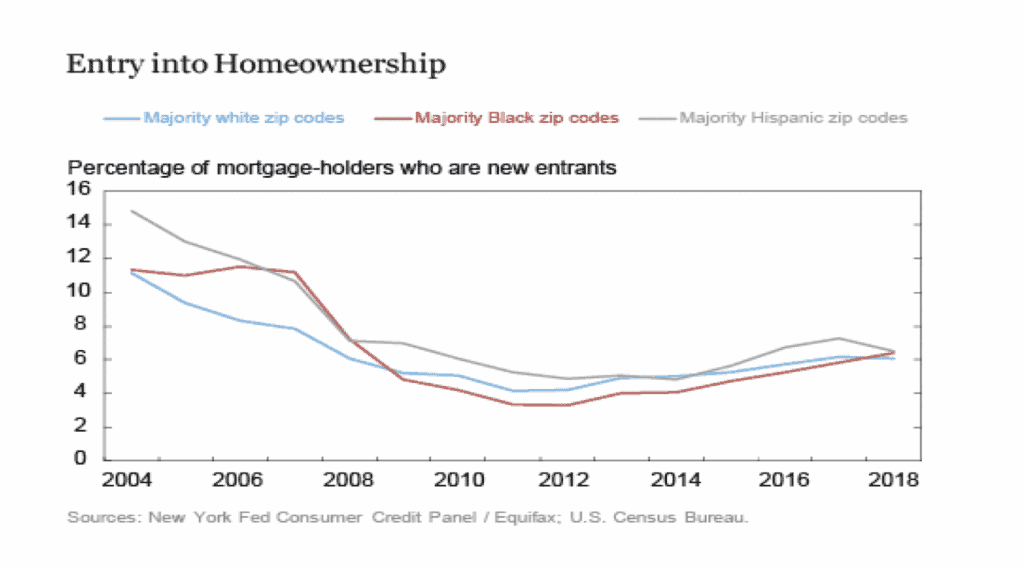
There is a similar trend for entrants to the housing market, proxied by new borrowers’ share of purchase originations. In majority Black areas, the rate of entry into homeownership (new mortgage-holders) was quite high during the boom years, then experienced a sharp decline and remained, until recently, below those in both majority white and majority Hispanic areas.
In our next installment of this two-part series, we’ll examine some of the explanations for these trends, from the impact of student loans to underwriting standards.
SOURCE