Liberty Street Economics (LSE), the research arm of the New York Federal Reserve, recently published a three-part series on different aspects of economic inequality during the COVID-19 driven financial downturn in 2020.
The first post in this series focused on how different wage-earners were impacted the most during the early stages of the COVID lockdowns, and also during the subsequent economic rebound. In this regard, LSE separated working Americans into four categories:
- LOW WAGE EARNERS (representing approximately 10 percent of all workers): These are workers typically earning $30,000 or less, and generally concentrated in the hardest hit industries, such as food service and home health care.
- LOWER-MIDDLE WAGE EARNERS (40 percent of total): These are jobs that pay between $30-50,000, including various tradespeople, like carpenters, as well as truck drivers and hairdressers.
- UPPER-MIDDLE WAGE EARNERS (40 percent of total): This group earns between $50-85,000 in industries such as education, law enforcement and accounting.
- HIGH WAGE EARNERS (10 percent of total): This group earns in excess of $85,000 as software developers, attorneys, business executives, etc.
The first chart below shows how each wage-earning group was impacted, especially during the initial lockdown period starting in February.
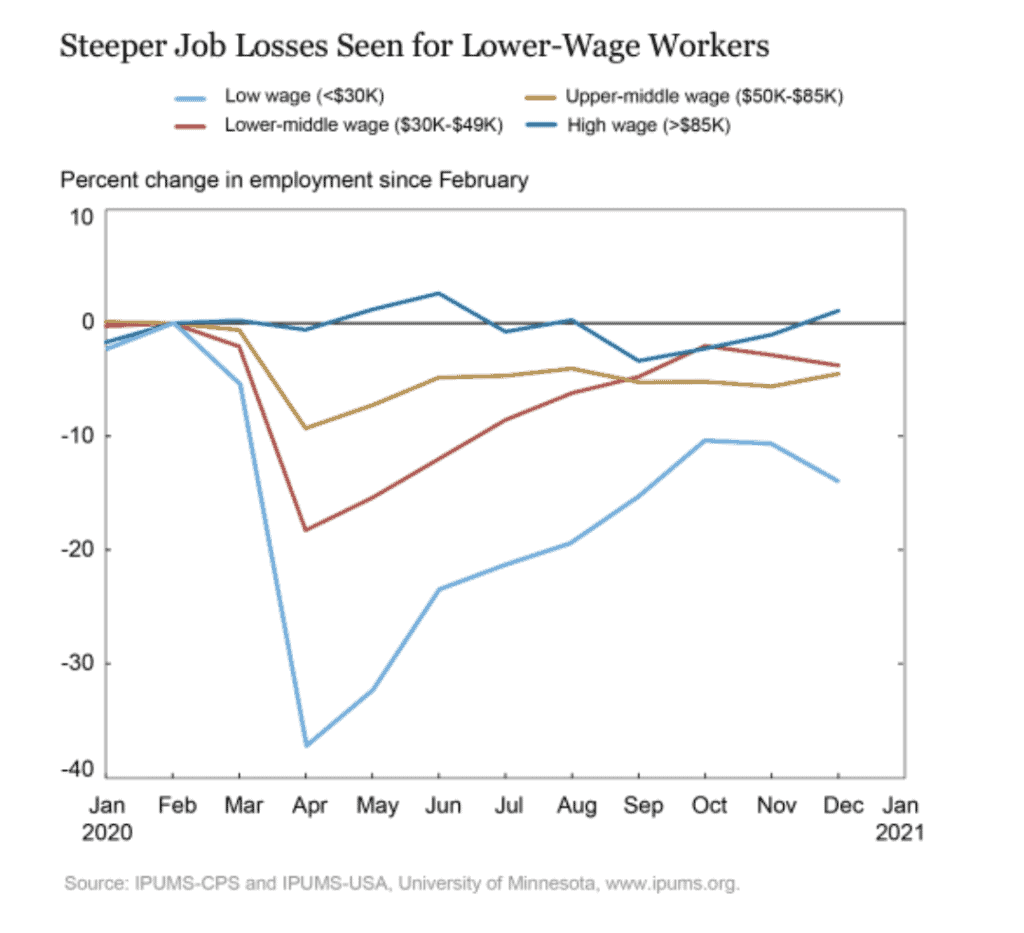
Here is what we see:
- There was more than a 30 percent drop in employment for the lowest wage earners between February and April. While employment for this group rebounded over the summer, we see another downturn in October, coinciding with the second wave of COVID.
- The low-middle earners suffered about an 18 percent drop in employment in the early stages, and, like the low wage earners, saw a second dip in employment after the summer recovery.
- There was a modest dip of 9 percent for the upper-middle group, who did not experience a second-wave decline.
- Those at the highest end of the wage scale experienced very little disruption, with the exception of a slight, mid-summer decline.
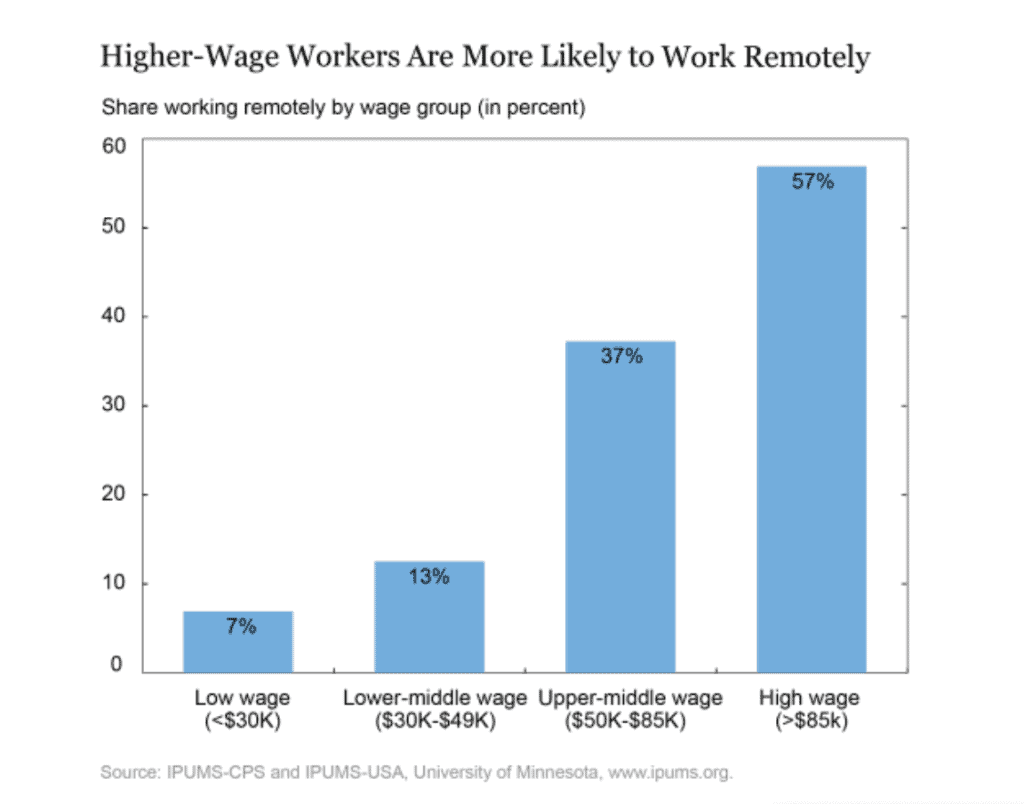
Not surprisingly, the high wage earners were able to avoid major disruption in employment and income, primarily because of their ability to work remotely relative to the other wage earners. The chart below reflects data from the Bureau of Labor Statistics, showing that nearly 60 percent of high wage earners were able to telecommute. By contrast, less than 10 percent of low wage earners enjoyed the luxury and convenience of remote work.
Finally, the LSE study looked at employment outcomes over the course of 2020, grouped by different categories, such as wage earners, education, race, gender and age.
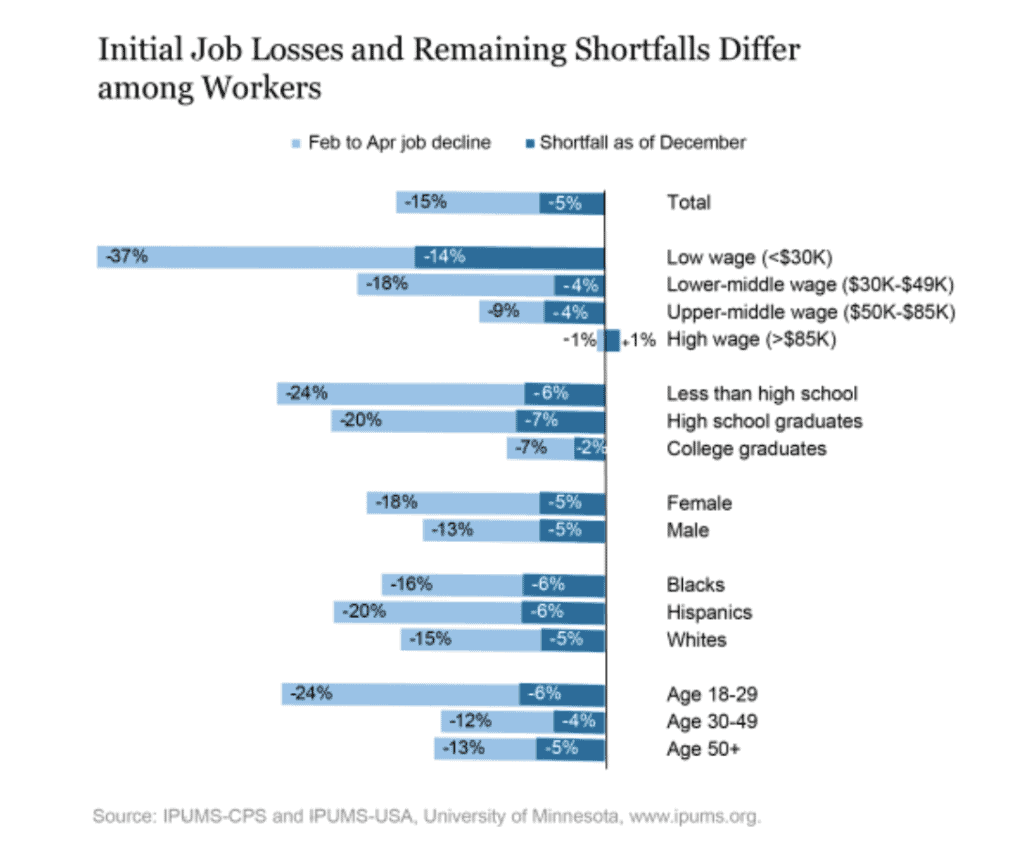
The length of each bar shows the level of unemployment for the three month period from February through April. The dark, solid blue sections shows us the employment shortfall as of the end of 2020-in other words, the degree to which each of these groups was able to rebound from the initial shock of the COVID lockdown.
On a national basis, we see that the employment shortfall at the end of 2020 sat at 5 percent, down from the April peak of 15 percent. In most categories, we see that the current shortfall is at or near the current national shortfall, with two notable exceptions:
- The employment shortfall for the lowest wage earners is still nearly three times the national average.
- College graduates have fared better than any other category, both in terms of peak (April) unemployment and their employment shortfall at year’s end.
In the next post in this series, we’ll take a look at how the ability to commute to a job impacted the racial and income gaps during the COVID economic recovery.
In the meantime, check out our extensive Unemployment Workbook on the RDS Tableau Public page.
SOURCE
To learn more about Recovery Decision Science contact:
Kacey Rask : Vice-President, Portfolio Servicing
[email protected] / 513.489.8877, ext. 261