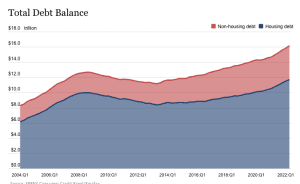
According to the Federal Reserve, total U.S. household debt as of Q2 was $16.15 trillion, an increase of 2%, or $312 billion from Q1.
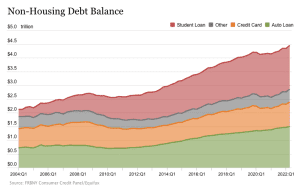
The first chart below breaks out household debt by housing and non-housing elements. The second chart takes a more detailed look at the non-housing elements. Here’s what we learn:
- Mortgage balances grew by $207 billion in Q2, now standing at $11.39 trillion.
- Credit card balances increased $46 billion since Q1. It’s worth noting that the 13% year-to-year increase was the largest in over 20 years. However, credit card balances still remain below their pre-pandemic levels.
- Auto loans were up $33 billion in Q2, which continues their steady, upward climb that began in the years following the Great Recession.
- The student loan balance of $1.59 trillion was essentially unchanged in the most recent quarter.
The growth in consumer debt reflects increase consumer borrowing to adjust for higher prices. Specifically:
- The average dollar amount for new purchase originations for both houses and autos increase 36% since 2019.
- Purchase mortgage origination volume is up 7% in Q2, reflecting increased borrowing amounts. Check out our recent BLOG POST on trends in the U.S. housing market.
- The $46 billion increase in credit card balances is the highest seen in over 21 years. Again, this increase reflects the fact that consumers are having to borrow more to offset higher prices.
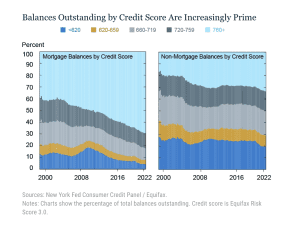
Despite these across-the-board increases in household debt, the Fed points out that the breadth of government support programs over the past two years went a long way toward cushioning the impact of the pandemic. In addition, at more than any time in history, household debt is “overwhelmingly” concentrated with borrowers who have the highest credit scores.
- On the left side of the chart below we see that the vast majority of mortgage balances are now held by those borrowers with the highest credit scores (light blue).
- When we remove mortgage debt from the equation, borrowers with the highest credit scores still hold the largest amount of household debt, but the distribution is now much flatter.
DELINQUENCY ON THE RISE
With the pandemic-related government support mostly ended, we are beginning to see the initial signs of economic distress with certain groups of borrowers.
The charts below look at transition into delinquency by zip code quintiles. As we see, the delinquency rates for credit cards and autos are slowly rising among borrowers in the lowest income areas.
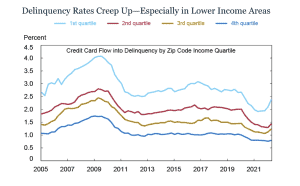
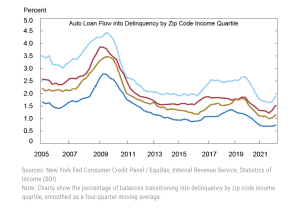
The Fed points out that these recent trends harken back to the situation we had in 2019 with rising delinquencies, primarily driven by borrowers who held sub-prime auto loans.
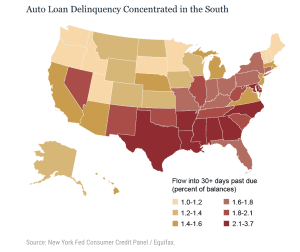
Finally, the chart below looks at the current state of auto-loan balances 30+ days past due on a state-by-state basis. The wide swings in delinquency rates shown on a geographic basis reflects both local economic conditions and variations in borrower compositions.
The recent uptick in delinquency rates suggests a possible return to the pre-pandemic levels. Still, the Fed argues that most Americans are benefitting from a robust economy and strong consumer demand. The question remains, of course, as to the impact increased inflations will have on the economy, and the most vulnerable Americans in particular.
SOURCE
To learn more about Recovery Decision Science Business Intelligence team contact:
Kacey Rask : Vice-President, Portfolio Servicing
[email protected]/513.489.8877, ext. 261