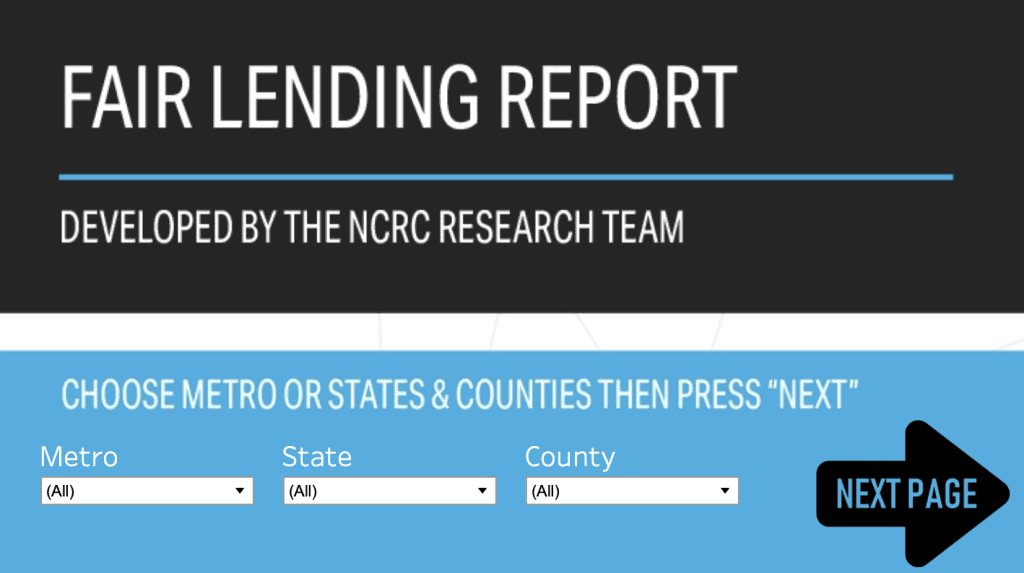
Over the past few months, Kevin Flerlage and Jeffrey Shaffer, RDS’s Tableau Zen Masters, have been donating their time to help the NCRC (National Community Reinvestment Coalition) redesign the organization’s Fair Lending Report interactive data dashboards.
We wrote about the project in our recent blog post, “NCRC and the RDS Tableau Zen Masters.”
Today we follow up with NCRC’s perspective on the project.
As a brief refresher, NCRC was created as an outgrowth of the Community Reinvestment Act (CRA), a 1977 federal law (modified nine times since) designed to encourage commercial banks and savings associations to help meet the needs of borrowers in all segments of their communities, especially majority-minority and low-to-moderate income populations.
NCRC works closely with community lenders, policy makers and financial institutions to “champion fairness and end discrimination in lending, housing and business”. The group’s 600+ members include:
- Community reinvestment organizations
- Community develop corporations
- Local and state governmental agencies
- Faith-based institutions
- Community organizing and civil-rights groups
- Minority and women-owned business associations.
THE IMPORTANCE OF DATA
Data plays a critical role for NCRC members in holding financial institutions accountable to the requirements in the CRA. In particular, NCRC members use data in two primary ways:
- To report to local government and housing agencies about where investment is happening or not happening. Generally, government agencies have little knowledge of where investment is flowing in local communities. So, for NCRC members, data helps bring value, and a degree of authority, to discussions with these governmental agencies.
- To work with local banks and financial institutions in developing plans for specific communities and neighborhoods. In essence, solid data helps to put NCRC members on equal footing with financial institutions when entering into these types of delicate negotiations.
“The challenge for any non-profit,” says Jason Richardson, NCRC’s Director of Research & Evaluation, “is to prove your worth to your stakeholders.”
In this regard, NCRC’s “worth” to its 600+ members is heavily tied to its ability to access and effectively report on data that is relevant to the needs of each member’s community.
ENTER TABLEAU AND RDS
Several years ago, Richardson was introduced to Tableau Software through a colleague.
For most of its history, NCRC relied on Excel spreadsheets and PowerPoint presentations to help members tell their local stories. As both the flow and complexity of data increased in recent years, formats like Excel and PowerPoint became less and less effective. “They were too rigid to handle our increasingly complex, and overlapping data sets,” Richardson says.
Fascinated by the potential of Tableau to energize NCRC’s storytelling capabilities, Richardson also realized that he could not afford the software on a non-profit budget. That’s when he learned about the Tableau Foundation, which was created in 2014 to “accelerate the use of data in solving the world’s problems.”
NCRC applied for and received a three-year grant from the Foundation, allowing them to develop interactive dashboards to support the organization’s primary member asset, the Fair Lending Report. With training support from Tableau, Richardson and his group developed the initial set of Fair Lending Report dashboards.
Shortly thereafter, Jason realized that his team lacked the advanced Tableau skills required to deal with the number and complexity of dashboards required to meet NCRC’s member needs. That’s when the Tableau Foundation stepped up again, by introducing NCRC to Recovery Decision Science, and its two Tableau Zen Masters, Kevin Flerlage and Jeffrey Shaffer. At the same time, the Foundation also increased NCRC’s data storage capacity, which afforded the RDS team the bandwidth to create the necessary dashboards.
Richardson laughs, recalling Kevin Flerlage’s initial reaction upon reviewing NCRC’s first version of the Fair Lending Report: “Whoa! That’s a lot of dashboards.”
Within weeks, the RDS team streamlined NCRC’s dashboard process, making it, in Richardson’s words, “slicker and more versatile.”
In total, Flerlage estimates that he and Shaffer invested more than 100 hours on the Fair Lending project for NCRC.
According to Richardson, RDS’s involvement was transformative in more ways than he could have imagined when the project started. He says that “internal feedback was over the moon!” He added: “It’s difficult for most of our members to understand and work with data. But these new interactive dashboards are simple enough to allow our members to explore and work with local data on their own time.”
One of the unanticipated benefits of the new Fair Lending Report is that Richardson expects the NCRC will increase membership. Just in the past few weeks alone, he has received nearly 700 requests from members and non-members alike to work with the new dashboards.
Richardson summed up the project with RDS as a “wonderful experience.” He added, “Kevin and Jeff can’t comprehend the massive boost they’ve given to our members. Because they don’t hear the feedback I get, I want them to know that they really accomplished something special here. It’s a big deal to our organization.”
The NCRC Fair Lending Report is available to the public until April 15.

CLICK HERE to check it out.
If you’d like to learn more about Recovery Decision Science, contact
Kacey Rask
Vice President, Portfolio Servicing
[email protected] / 513.489.8877, ext. 261
Error: Contact form not found.

