On Monday, April 27, we posted the article below about our analysis of mortgage trends since 1971.
Since then, the 30-year fixed mortgage rate has hit a 50-year low, at 3.23%. Accordingly we’ve updated our viz on Tableau, adding a weekly view of mortgage trends.
As a result of the federal government’s efforts to stabilize the economy in the face of the COVID-19 crisis, the 30-year fixed mortgage rate in March fell to 3.45%.
This rate is consistent with the historic lows we’ve seen over the past decade.
- October, 2012: 3.38%
- August, 2011: 3.41%
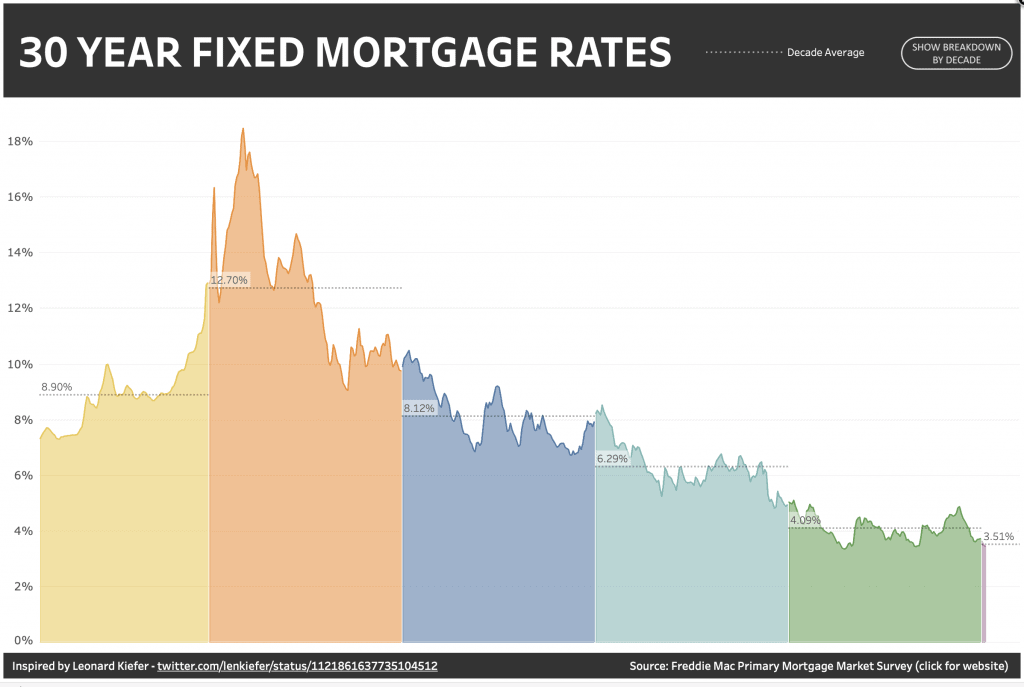
Using the Freddie Mac Primary Mortgage Survey, Recovery Decision Science analyzed 30-year fixed mortgage rates over a five-decade period, starting in January, 1970.
CLICK HERE to see our interactive viz covering mortgage trends on both a monthly and weekly basis.
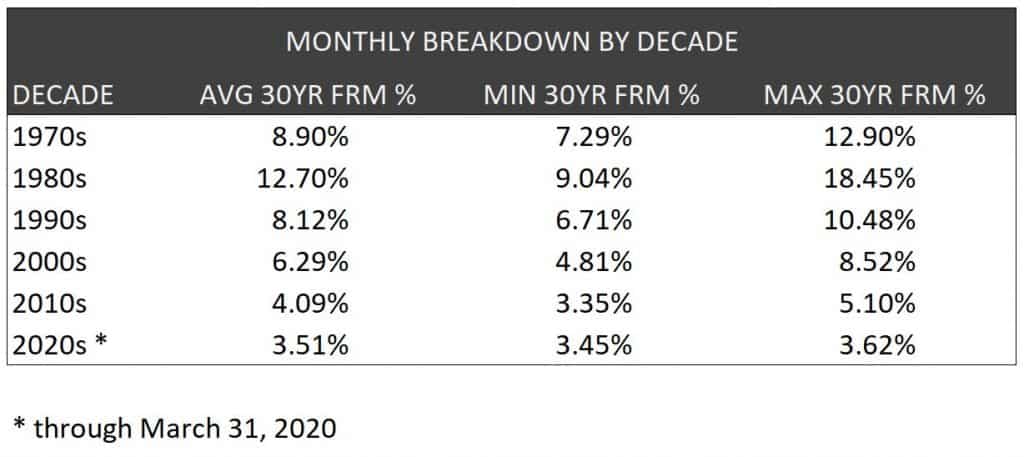
As you can see from the summary table below:
- Mortgage rates in the 1980s far exceeded those of any other decade. In fact, the average rate during 1981 topped 17%, hitting a high of 18.45% in October of that year. The Fed kept interest rates high during those months in order to fight double-digit inflation.
- By contrast, the decade of the 2010s saw consistently low 30-year fixed mortgage rates, driven, of course, by the Fed’s response to the Great Recession.
- Rates continue to trend down in the initial months of 2020, especially as the Fed responds to the impact of the pandemic. The question, of course, is whether or not lower mortgage rates can stimulate home sales if unemployment levels remain high for the foreseeable future.
RDS will update this report on a monthly basis.