In our most recent post, we summarized the New York Fed’s household debt report for Q4 2017.
Today, we’ll look at a follow-up report focused on regional trends in mortgage debt.
As we reviewed in the previous post, overall household debt has increased in the most recent quarter and has now surpassed its previous peak of $12.68 in Q3 2008. But what is most notable is the regional disparity in mortgage debt, as summarized by the Fed below:
“Some regions of the country have long surpassed their earlier peak, while the areas hit hardest during the Great Recession-those with the largest home price declines and highest foreclosure rates-have aggregate mortgage balances far below their previous peaks, even as home prices have largely recovered.”
MORTGAGE BALANCE TRENDS BY STATE
The map below looks at the percent change in aggregate balance by state since their peak in Q3 2008. Here’s what we see:
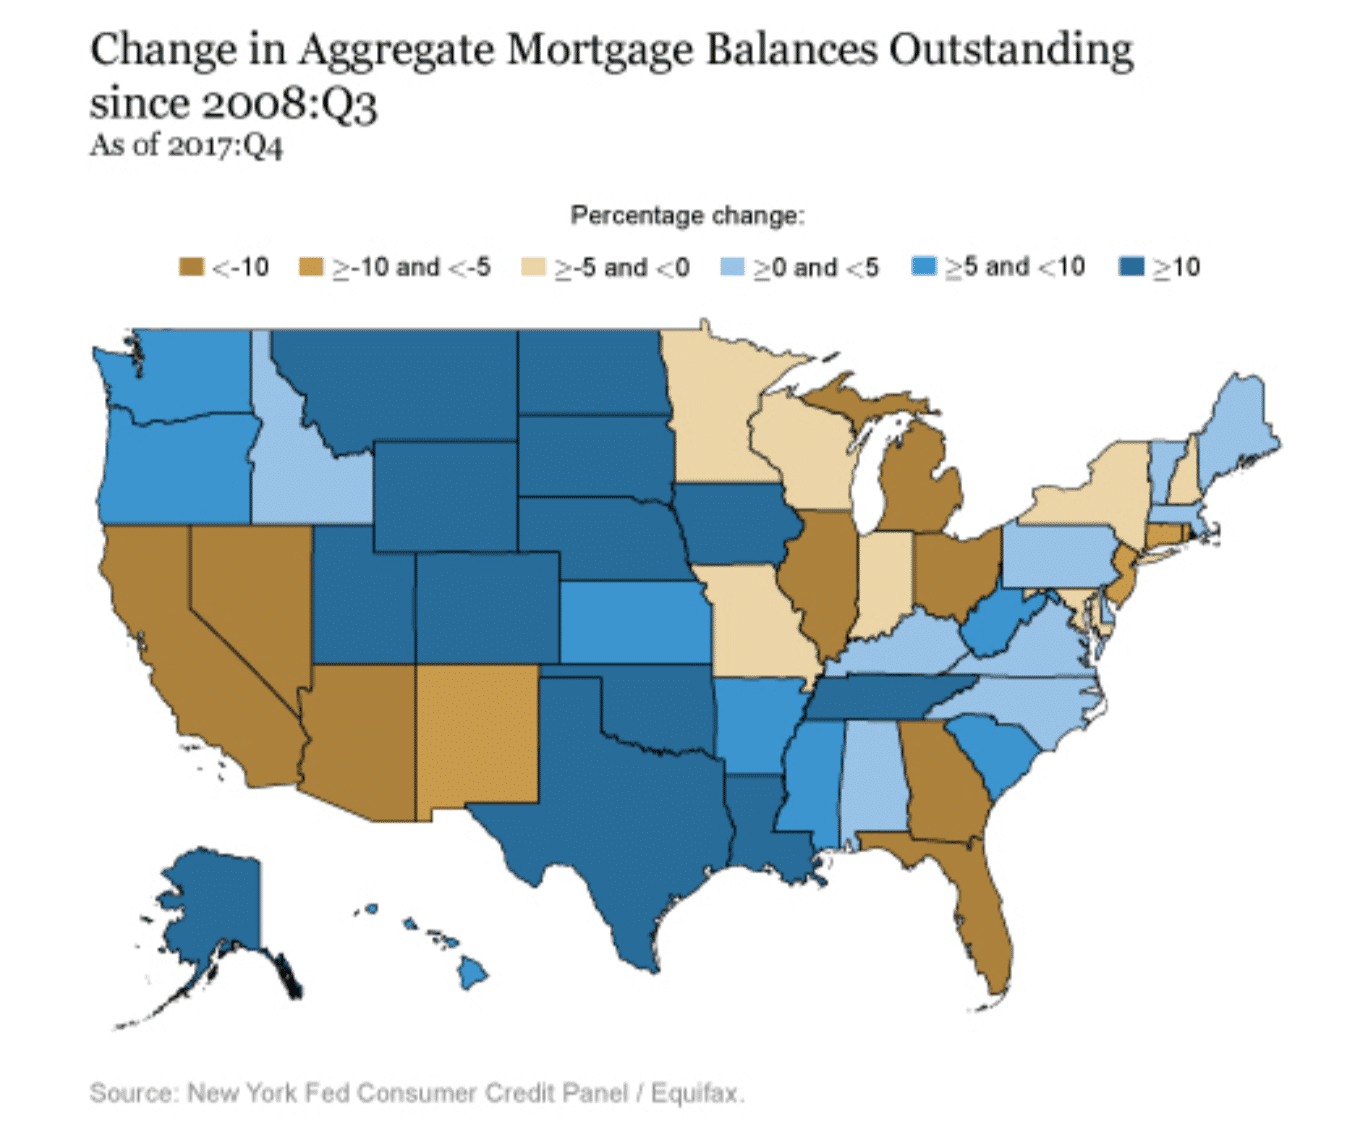
- Dark blue states, notably Texas, The Dakotas, Montana, have aggregate mortgage balances more than 10% above their previous peaks. These are states that did not experience the dramatic housing boom-bust cycle seen by many other states, such as…
- States such as Florida, Arizona, Nevada and California. These are states that were severely impacted by the Great Recession and have not fully rebounded, showing mortgage balances more than 10% below their peak
MORTGAGE TRENDS BY COUNTY
The map below digs deeper, looking at aggregate mortgage balances by county. Notable highlights:
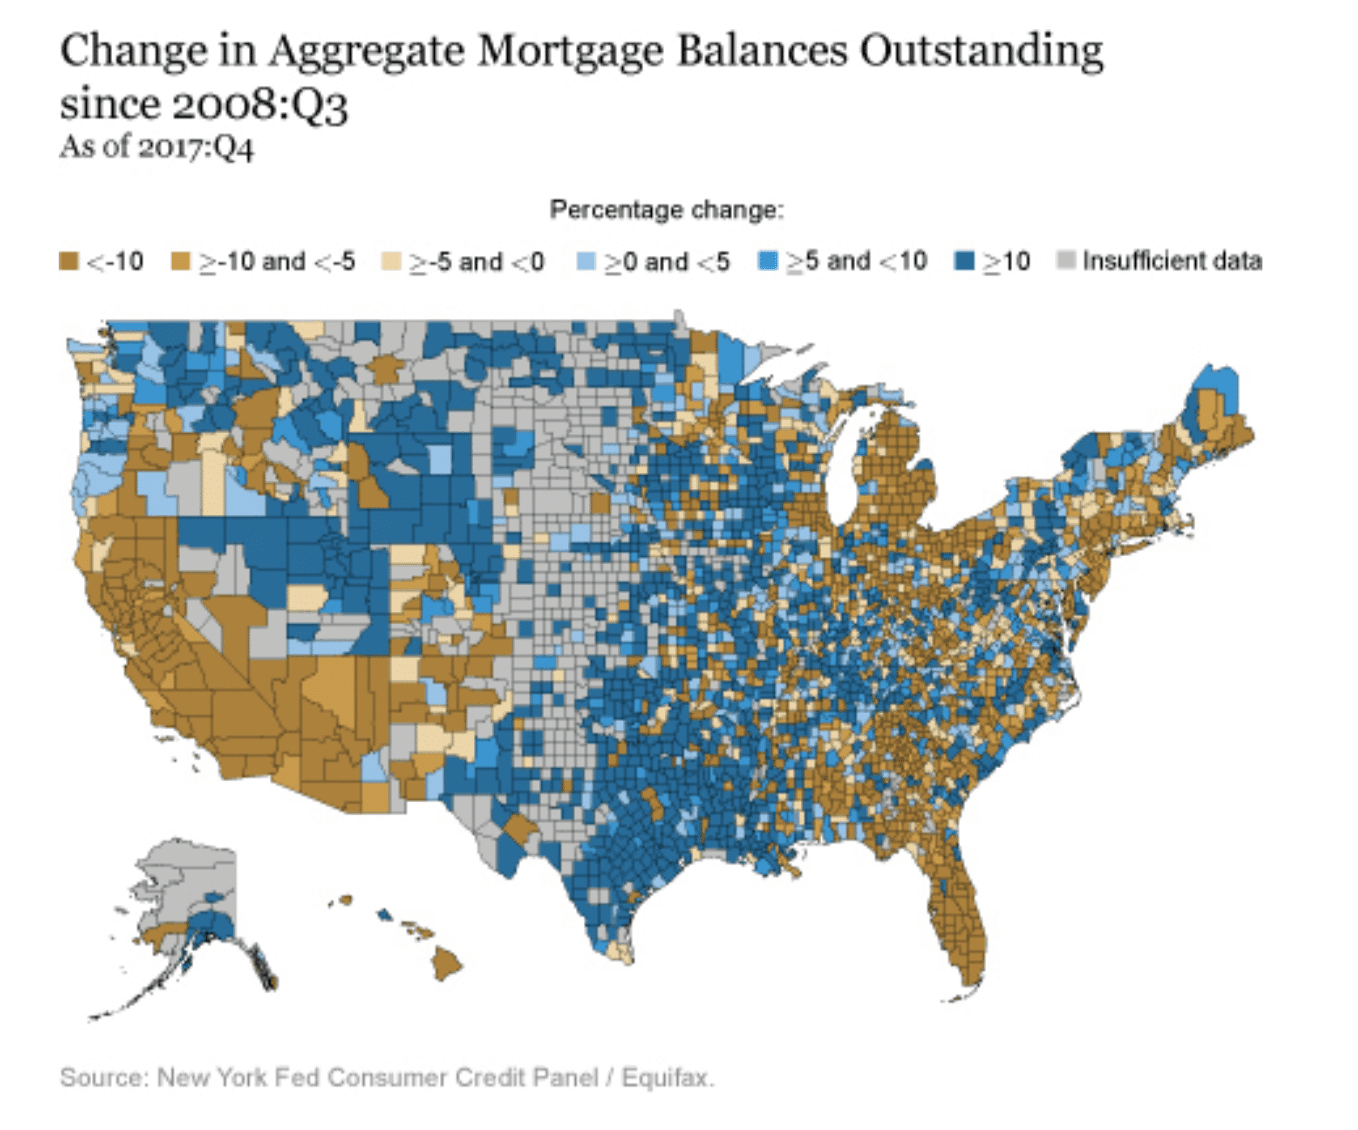
- While most states include some combination of negative and positive growth counties, a vast majority of counties are still well below their peak in certain states, notably: Florida, Arizona, California and Nevada.
- States in the Northeast are more mixed. Some counties show significant gains while others (i.e. most of New Jersey) remain well below their Q3 2008 peak.
MORTGAGE BALANCES AND HOUSE PRICES
The chart below takes an interesting look at the relationship between changing house prices and aggregate mortgage balances on a state-by-state basis:
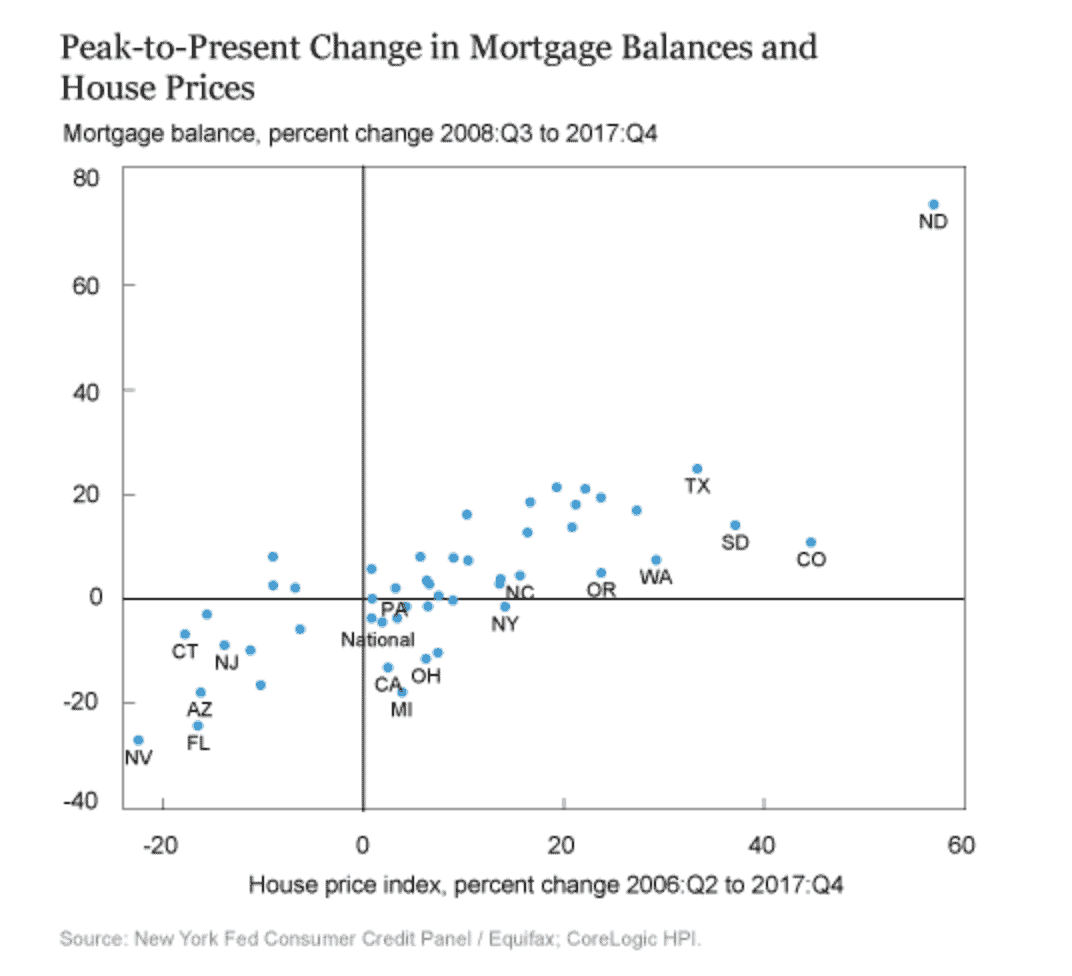
- Vertical axis: Q3 2008 peak-to-present change in mortgage balances
- Horizontal axis: Q2 2006 peak-to-present change in home prices
Let’s take a look at the lower left quadrant:
- While home prices in states like Florida, Arizona and Nevada have partially recovered from the Great Recession, they still remain well below their peaks. These are the states that experienced the most dramatic house price boom-bust cycles.
- Other states in this same quadrant-like New Jersey and Connecticut-did not experience similar boom-bust cycles, but still have stagnant house prices.
- Mortgage balances in the lower left quadrant remain well below their Q3 2008 peaks. This is partially explained by the high concentration of foreclosures that reduced balances through charge-offs. But it also reflects the fact that households are actively paying down existing balances.
Let’s move to the upper right quadrant:
- Many states in this quadrant-such as Texas and Colorado-missed the dramatic housing boom-bust cycle. These states have continued to enjoy steady home price growth since the Q2 2006 peak, with a related increase in aggregate mortgage balances
- The most notable case in this quadrant is North Dakota which has benefitted from its recent oil boom. This state has enjoyed dramatic growth in both aggregate mortgage balances and home prices.
SUMMARY: HOME EQUITY AND HOME OWNERSHIP
According to mortgage research from Black Knight, U.S. home equity is at an all-time high. Increased house prices combined with stagnant mortgage balances have helped Americans rebuild equity and overall household wealth. Unfortunately, rising home prices make it difficult for first-time home buyers to enter the market. This obviously has negative long-term implications for home ownership in America.
SOURCE: