In our last post, we examined the Federal Reserve Bank of San Francisco’s 2019 Diary of Consumer Payment Choice, which studied the performance of cash as a payment vehicle
In Part Two of our series on cash transactions, we take a look at which age groups are most likely to use cash – you might be surprised – and what types of households hold the most cash.
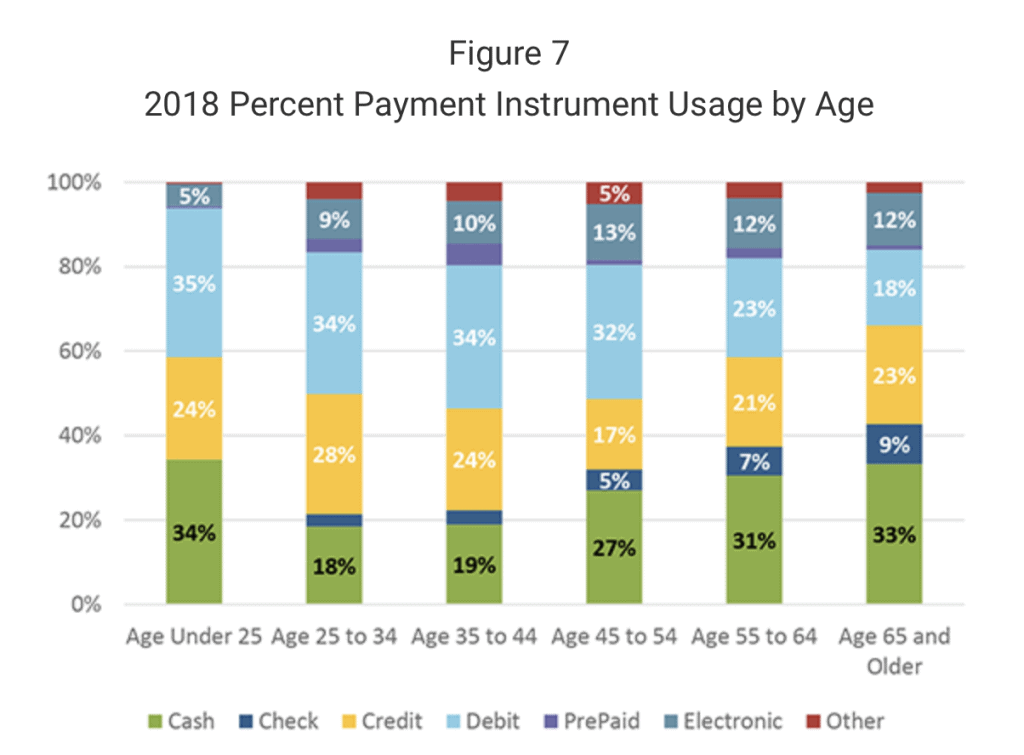
The Diary reviewed date from 2018, the most recent year for which information is available. Payment preferences remained similar to those stated in 2017, with most participants – 42 percent — paying with debit cards. Credit cards came in second as a payment choice, at 29 percent, and cash came in third at 22 percent.
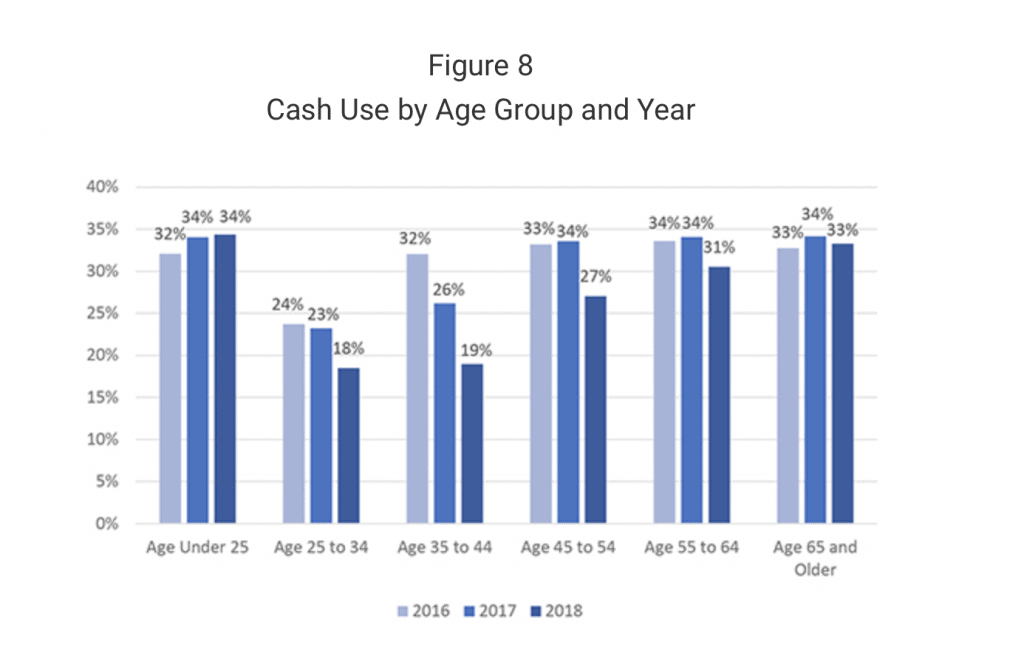
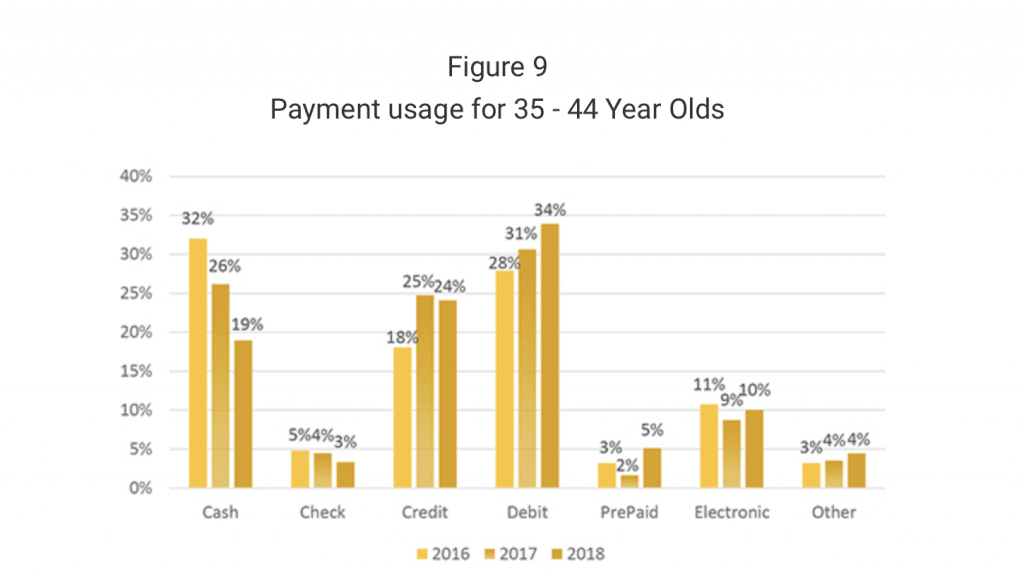
Cash is used among all age groups, but the share of cash use tends to be higher among individuals 18 to 25 and those older than 45 (Figure 7). Even though individuals over 45 tend to use cash at a higher rate, their cash use has declined approximately 3 percentage points, from 33 percent in 2017 to 30 percent in 2018. The largest drop came from the 45 to 55 age group, for which cash use dropped 7 percentage points over the course of a year (Figure 8). A portion of this decrease was the result of increased total payments from 2017 to 2018, but the decrease in cash for this age group was partly offset by an increase in the share of debit card usage by 5 percentage points, while credit card usage remained consistent. Ages 25 to 44 continue to have the lowest cash use. Specifically, the 35 to 44 age group has shown large declines in cash usage over the years, declining 13 percentage points since 2016. This age cohort seems to have replaced cash usage primarily with an increase in debit card usage, with credit also contributing (Figure 9).
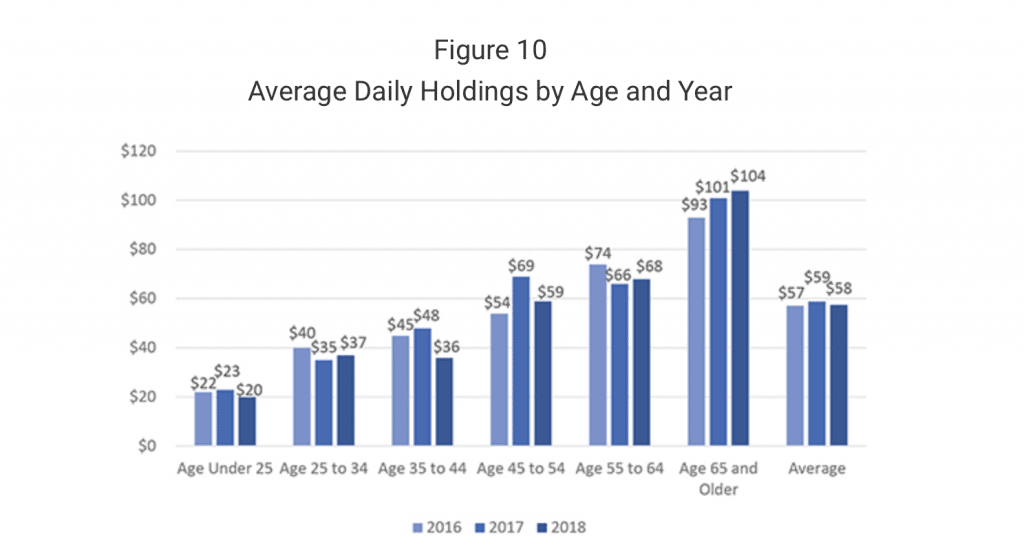
The amount of cash held by consumers varies significantly based on age and income. Cash holdings are highest among individuals over the age of 65 – a trend that has continued since the Diary began – with the average value held in 2018 increasing to $104. The amount of cash held by other age groups has fluctuated with no obvious pattern emerging. However, the average value of cash held among all participants has remained steady over the past three years: ranging from $57-$59 (See figure 10)
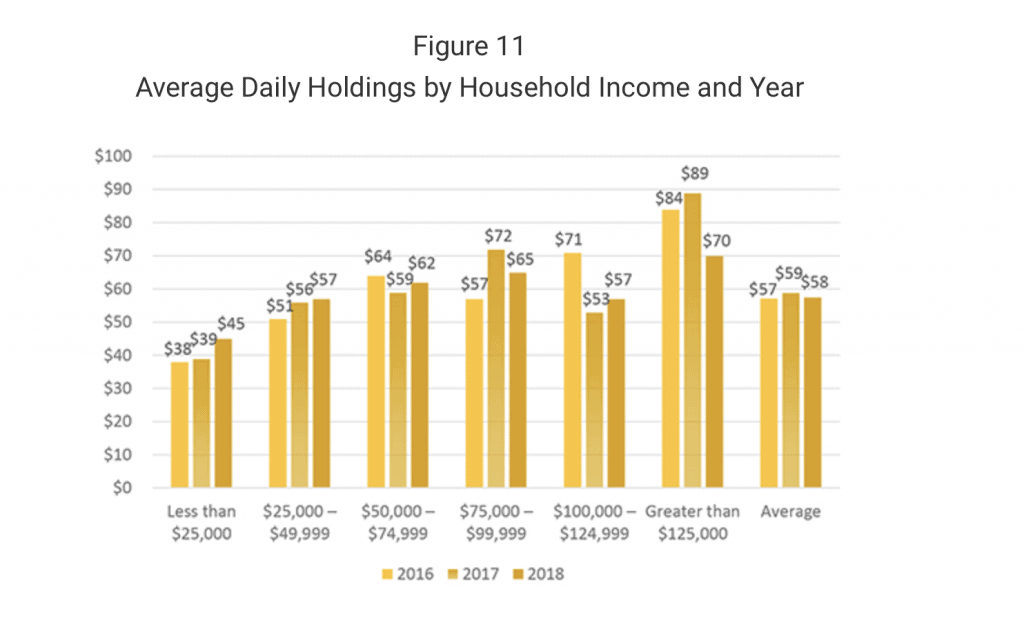
Cash holdings vary by household income as well, though the difference is not as dramatic and the correlation not as strong. While those living in households earning more than $125,000 hold the highest amount of cash, there was a noticeable decrease in value reported in 2018 (See figure 11). Additionally, the amount of cash held by households earning between $25,000 and $49,999 and the amount held by households with significantly higher annual earnings – $100,000 and $124,999 – is the same, and is similar to the value held at income levels in between. The most noteworthy pattern for cash holdings by household income is from lower-income households: those that earn less than $50,000 annually have been increasing the amount of cash they hold for the past three years, a trend not present for individuals in households earning more than $50,000.
The rise of online shopping and e-commerce has increased the share of transactions that are “not-in-person, but 73 percent of all payments continue to be made physically at the point of sale.
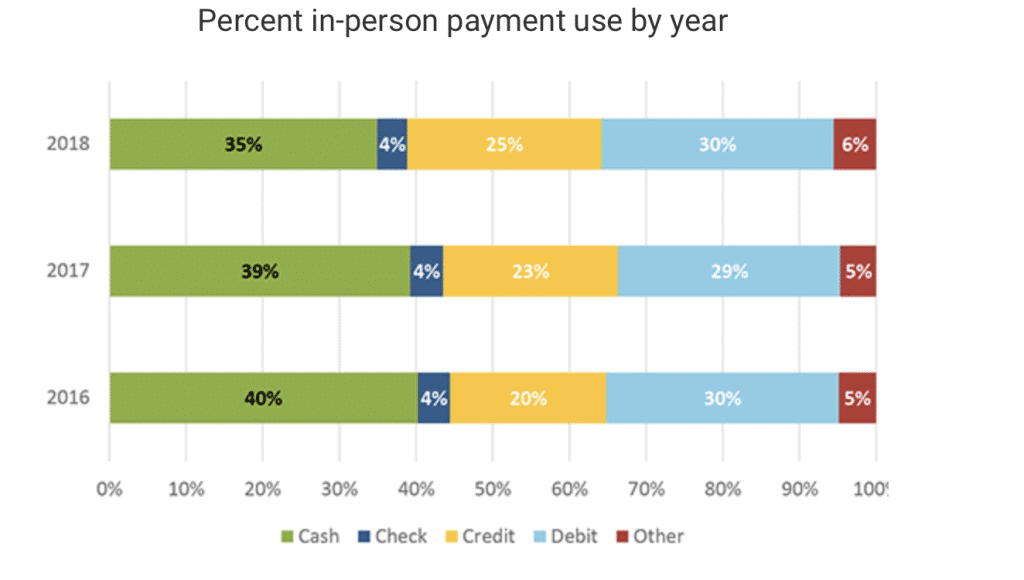
Since the option to use cash is largely confined to in-person payments, cash’s share rises when looking exclusively at in-person transactions. Just as with overall payment shares, use of cash for in-person payments posted a four percent decline between 2017 and 2018. Even so, cash is the most used payment instrument for in-person payments at 35 percent, shown below. In-person credit card usage has grown over the last few years, cutting into cash’s share, while debit card use has remained relatively stable.
Although consumers are paying with cash less often, the amount of cash they hold on a regular basis has remained consistent, ranging from $57 to $59. Cash use continues to be popular among younger and older age groups, who use cash for approximately one third of payments. Cash is also the most used payment instrument for transactions that take place in-person, which is where almost three-quarters of all payments take place and where nearly 90 percent of non-bill payments are conducted.
SOURCE