Since the start of the pandemic, the RDS Business Intelligence team has been tracking trends in the U.S. labor market through our Tableau Public page. You can find 18 interactive unemployment workbooks by visiting our RDS TABLEAU PUBLIC page.
UNEMPLOYMENT SUMMARY
Claims
For the month of August there were 766,413 initial unemployment claims. This represents a 38% drop from 2022’s high of 1,245,325. For perspective, the current level of initial claims is down 96% from the historic high of 17 million set in March, 2020.
Unemployment Rate
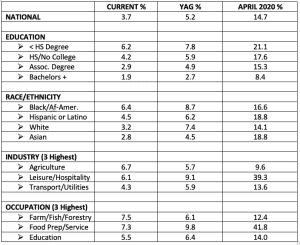
The current national unemployment rate stands at 3.7%, down slightly from the ingoing 2022 rate of 4.0. The unemployment rate has remained steady in the 3.7% range throughout this year.
We’ve also been tracking the rate of unemployment by various demographic groups and labor sectors. The chart below looks at the current unemployment rate by group, comparing it to the rate a year ago, and also to April, 2020 which was the unemployment high point of the pandemic.

JOB OPENINGS AND LABOR TURNOVER
Earlier this year, we wrote a blog on A Deep Dive Into the Great Resignation. The post looked at how millions of Americans have walked away from their jobs just as the economy was beginning to recover from the Covid-19 economy. Perhaps cushioned by government stimulus checks and extended unemployment support, many Americans used their downtime to reassess the meaning of work in their lives. As we wrote at the time, this attitude shift created a “buyer’s market” for workers who are searching for better pay, greater security, and more flexibility in their work lives.
Today we take an updated look at job openings and turnover in the labor market.
Job Turnover
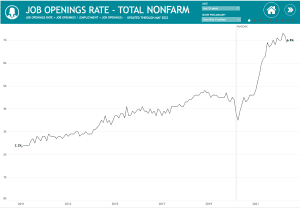
As you can see in the screenshot below, 6.9% of non-farm jobs remain open as of the most recent report from the Bureau of Labor Statistics. This is essentially the same level we saw back in March when we wrote the Great Resignation post.

For reference, a job is considered “open” if it meets all three of the following variables:
- A specific position exists (full or part-time) and there is work available for that position.
- The job could start within 30 days.
- The employer is actively recruiting from outside the organization.
HIRES VS. SEPARATIONS
Perhaps the most telling statistic to put context around the Great Resignation is the relationship between hires and separations. Let’s define each:
- Hires include all additions to the payroll during the reference month, such as newly hired or newly rehired employees.
- Separations reflect all separations from the payroll: quits, layoffs, discharges and other separations, not including retirements.
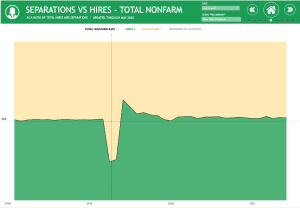
Below is a screenshot of the current Hires vs. Separations Tableau workbook.
Here’s what we see:
- In the months leading up to the pandemic, the hire rate (green) stayed slightly ahead of the separation rate (yellow).
- Then, in March 2020, as the economy went into shutdown mode, the separation rate hit an astounding 75.8.
- By May 2020, we saw a dramatic swing in the opposite direction as the hiring rate hit 63.3%.
- As of the most recent report, the gap is beginning to return to pre-pandemic levels, but there is still a 4-point spread between the hire rate (52%) and the separation rate (48%).
UNEMPLOYED PERSONS VS. JOB OPENINGS
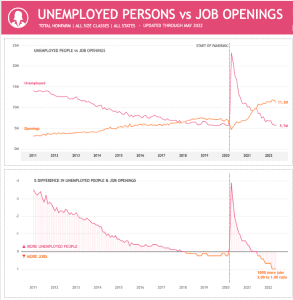
Finally, we look at the gap between current job openings and unemployed persons, both from a raw data perspective as well as the percentage difference between the two measures. See the screenshots below:
As you can see, there is currently a two-to-one ratio of jobs to unemployed peoples, or 100% more jobs (11.3 million) than there are unemployed people (5.7 million). Contrast this to April, 2020, when we had 390% more unemployed people than available jobs, a 4.90 to 1.00 ratio. After reaching a 1.00 to 1.00 ratio in May, 2021, the jobs to unemployed people ratio has risen steadily to its current 2:00 to 1:00 ratio.
CLICK HERE to go to the Job Openings and Labor Turnover page on Tableau Public.
To learn more about Recovery Decision Science Business Intelligence team contact:
Kacey Rask : Vice-President, Portfolio Servicing
[email protected]/513.489.8877, ext. 261


